Future AGI + OpenAI Agents SDK in 2026: Real-Time Tracing, MCP Visibility, and Automated Evaluations in Three Lines
Add tracing, MCP visibility, evaluations, and alerts to OpenAI Agents SDK in 3 lines with Future AGI traceAI in 2026. Apache 2.0, OpenTelemetry-native.
Table of Contents
TL;DR: Future AGI + OpenAI Agents SDK in 2026
| Capability | What you get |
|---|---|
| Setup | 3 lines: register(), OpenAIAgentsInstrumentor().instrument(...), MCPInstrumentor().instrument(...) |
| License | traceAI Apache 2.0, ai-evaluation Apache 2.0 |
| Trace shape | OpenTelemetry spans, export to any OTel backend or Future AGI platform |
| Agents SDK coverage | Runner.run, Agent, tool calls, handoffs, LLM requests, retries |
| MCP coverage | Tool calls, args, results, latency, error types |
| Evaluations | Faithfulness, hallucination, PII, toxicity, task completion via Turing models |
| Alerting | Email and webhook alerts on latency SLO, eval score drops, safety breaches |
| Code changes to agent | Zero |
Install and instrument in one block:
from traceai_openai_agents import OpenAIAgentsInstrumentor
from traceai_mcp import MCPInstrumentor
from fi_instrumentation import register

trace_provider = register(project_name="my-agents-app")
OpenAIAgentsInstrumentor().instrument(tracer_provider=trace_provider)
MCPInstrumentor().instrument(tracer_provider=trace_provider)
That is the full integration. Every Runner.run(...) call now emits OTel spans and the Future AGI platform attaches evaluator scores on top.
Why the OpenAI Agents SDK Needs Observability Before Production in 2026
The OpenAI Agents SDK is a clean, minimal orchestration primitive for building tool-using and multi-agent systems on top of the OpenAI Python SDK. It is also a black box by default. Once you move from a prototype to a production deployment, three questions matter:
- When the agent gives a wrong answer, what tool call or sub-agent caused it?
- When latency spikes, which step (LLM, tool, MCP server) is the bottleneck?
- When the agent fails, was it the prompt, the tool, the handoff, or the model?
You cannot answer those by reading logs. You need agent-level traces, attached evaluations, and alerts. Future AGI is built for that workflow and integrates with the OpenAI Agents SDK with three lines of code.
Three-Line Setup: How to Add OpenAI Agents SDK Observability with traceAI
Install traceai-openai-agents, traceai-mcp, and fi-instrumentation, then add the initialization block to your app entry point:
from traceai_openai_agents import OpenAIAgentsInstrumentor
from traceai_mcp import MCPInstrumentor
from fi_instrumentation import register

# 1. Register your project with Future AGI
trace_provider = register(project_name="my-awesome-agent")

# 2. Instrument the OpenAI Agents SDK and MCP runtimes
OpenAIAgentsInstrumentor().instrument(tracer_provider=trace_provider)
MCPInstrumentor().instrument(tracer_provider=trace_provider)
Set FI_API_KEY and FI_SECRET_KEY in your environment if you want spans to land in the Future AGI managed platform. Point your own OTel collector at the same trace provider if you want spans in Jaeger, Tempo, Honeycomb, or any other OTel-compatible backend instead. The instrumentors are pure OpenTelemetry, so the choice is yours.
The packages are part of the Apache 2.0 traceAI monorepo. License is verifiable at github.com/future-agi/traceAI/blob/main/LICENSE.
From Black Box to Glass Box: What You See After Instrumenting
Once instrumented, the platform captures the full lifecycle of every agent request.
End-to-End Agent Tracing: Prompts, Tool Calls, Token Usage, and Agent Handoffs
The OpenAIAgentsInstrumentor emits spans for:
- The top-level
Runner.run(...)call. - Each
Agentinvocation inside the run. - Every tool call, with arguments and results.
- Every LLM request, with prompt, response, token usage, and latency.
- Agent-to-agent handoffs, so you can visualize how a request flows through a multi-agent topology.
Nothing changes in your agent code:
import asyncio
from agents import Agent, Runner

triage_agent = Agent(name="triage", instructions="...", tools=[...])

async def main():
    result = await Runner.run(triage_agent, "What's the weather and then tell me a story?")
    return result

asyncio.run(main())
The full trace appears in your OTel backend or the Future AGI dashboard automatically.
MCP Tool Call Visibility: Latency, Errors, and Schema Issues in One Place
Many production agents rely on external tools via the Model Context Protocol (MCP). When a tool is slow or returning malformed schema, the agent looks broken even though the model is fine. MCPInstrumentor emits spans for:
- Every MCP tool call.
- Tool arguments and results.
- Per-call latency.
- Error types (timeout, schema mismatch, auth failure, server error).
This makes it trivial to spot a slow MCP server or a tool with intermittent 5xx errors without touching the tool server code. For the eval side, see how to evaluate MCP-connected AI agents.
Real-Time Trace Stream: Production Pulse on Every Request
Traces tell you what happened. Evaluations tell you if it was good. Alerts tell you when to wake up. Future AGI stitches all three onto the same span graph so you can pivot from “spike in latency” to “which tool” to “did the response also fail the faithfulness evaluator” without leaving the dashboard.
Live Dashboards: How to Read Your Agent’s Vital Signs
The moment your instrumented agent serves its first request, the Future AGI dashboard fills in:
- Performance. End-to-end latency per request, per agent, per tool. Slow-tool flame graphs.
- Cost. Token consumption and estimated provider cost per trace.
- Reliability. Error rates by agent, by tool, by MCP server.
- Usage patterns. Request volume, top intents, handoff distributions.
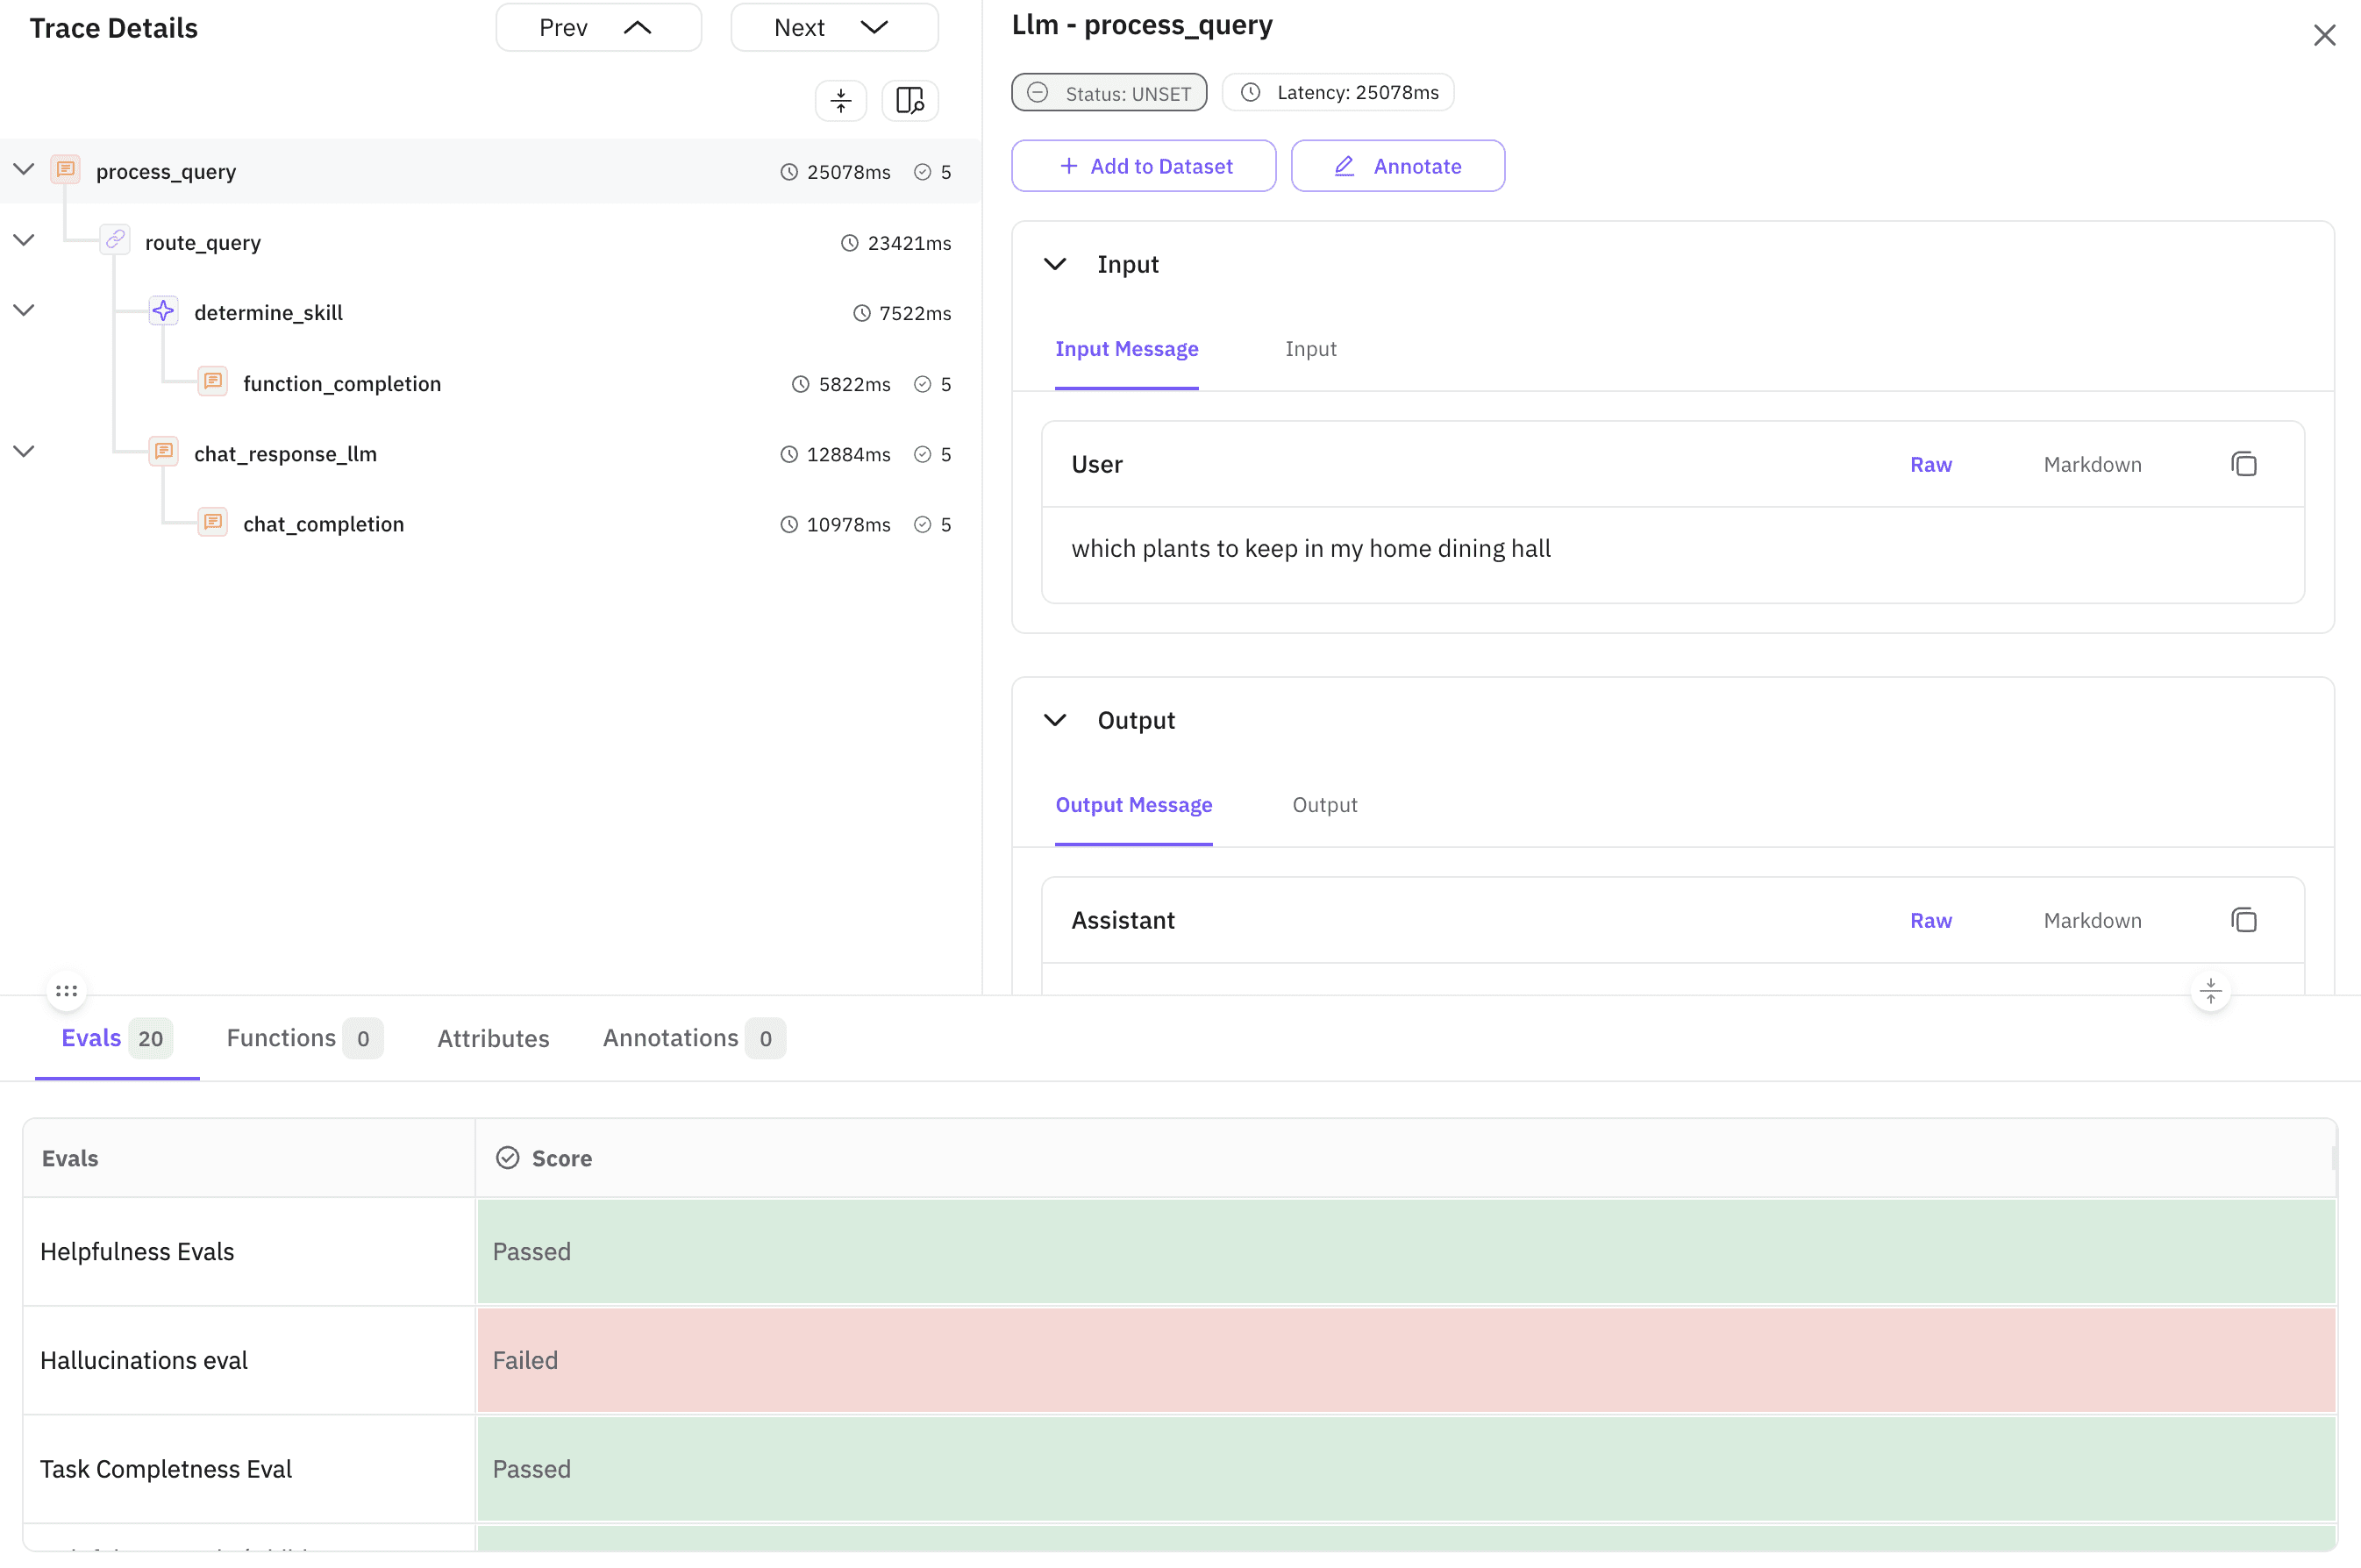
Image 1: Real-time agent trace dashboard.
Automated Evaluations: How to Move from “Works” to “Trusted in Production”
A trace can show that an agent finished a request successfully and still leave you blind to whether the answer was correct. That gap is what automated evaluations close. For the rubric set specific to this SDK, see evaluating OpenAI Agents SDK.
Future AGI treats evaluation as a first-class part of the workflow. The ai-evaluation library ships under Apache 2.0 (LICENSE) and exposes a string-template API:
from fi.evals import evaluate

result = evaluate(
    "faithfulness",
    output="The capital of France is Paris.",
    context="France is a country in Western Europe. Its capital is Paris.",
)
print(result.score, result.reason)
Pre-built evaluators cover what most teams ship against:
- Faithfulness, groundedness, context relevance, answer relevance.
- Hallucination, factual accuracy, completeness.
- PII, toxicity, bias, prompt-injection.
- Task completion for agent traces.
Custom LLM-as-judge evaluators are supported via CustomLLMJudge and LiteLLMProvider:
from fi.opt.base import Evaluator
from fi.evals.metrics import CustomLLMJudge
from fi.evals.llm import LiteLLMProvider

judge = CustomLLMJudge(
    name="cite_check",
    grading_rules="Score 0-1: does the answer cite the provided source?",
    model=LiteLLMProvider(model="<your-judge-model>"),
)
my_evaluator = Evaluator(judge)
Cloud evaluator runtimes on the Future AGI platform fall into three latency tiers (per docs.futureagi.com/docs/sdk/evals/cloud-evals):
turing_flashfor ~1-2 second latency on common checks.turing_smallfor ~2-3 seconds with more nuance.turing_largefor ~3-5 seconds on the hardest grading tasks.
You can run evaluators across the full lifecycle:
- In development. Golden dataset diffing in CI to catch regressions before merge.
- In production. Sampled live traffic continuously evaluated and attached to traces.

Image 2: Real-time agent monitoring dashboard.
Smart Alerting: Wake Up Only When Something Actually Breaks
You cannot watch a dashboard all day. Smart alerts close the loop:
- Performance degradation. Trigger when end-to-end latency exceeds your 2-second SLO.
- Reliability issues. Trigger when a tool error rate or evaluator failure rate crosses a threshold.
- Quality drops. Trigger when the faithfulness or task-completion score drops by more than X% week-over-week.
- Safety breaches. Trigger when PII or prompt-injection evaluators flag a production trace.
Channels include email and webhooks for routing into Slack, PagerDuty, or your incident system.

Image 3: Real-time AI agent metrics dashboard.
Why This Matters for Production AI: Confidence, Faster Debugging, Cost Control, and Continuous Improvement
Integrating Future AGI with the OpenAI Agents SDK is about more than collecting telemetry. It is about closing the loop between what your agent does, whether it is doing it well, and how to know when it stops.
- Build with confidence. Validate behavior on a golden set before shipping; verify it on sampled traffic after.
- Fix problems faster. Go from “it’s broken” to a specific tool call and prompt diff in minutes.
- Optimize performance and cost. Spot slow tools, inefficient prompts, and runaway loops in the same view.
- Improve continuously. Use evaluation deltas to guide prompt and agent changes instead of guessing.
Ready to add OpenAI Agents SDK observability? Install traceai-openai-agents, traceai-mcp, and fi-instrumentation, drop in three lines at startup, and your agent’s behavior shows up live with no changes inside your agent logic. For wider context on the Future AGI agent stack, see the open-source agent reliability stack guide and the best AI agent observability tools roundup.
How Future AGI Turns OpenAI Agents SDK Apps from Prototypes Into Trusted Production Systems
The integration of Future AGI with the OpenAI Agents SDK changes the shape of how teams build, monitor, and improve agents. With minimal setup and zero changes to existing agent logic, you elevate experimental agents to production-ready systems that you and your users can trust.
Read more in the Future AGI observability docs, the traceAI repository, and the ai-evaluation library.
Frequently asked questions
How do I add Future AGI tracing to my OpenAI Agents SDK app in 2026?
Do I need to change my existing OpenAI Agents SDK code to use Future AGI?
Will adding traceAI instrumentation slow my agent down?
Is traceAI open source?
How does Future AGI handle PII in OpenAI Agents SDK traces?
What evaluations can I run on OpenAI Agents SDK output?
How are Future AGI's model-based evaluators different from a generic LLM-as-a-judge?
Can I see MCP tool call latency and errors in Future AGI?

Gemini 3.5 Flash dropped today at Google I/O 2026. The 8 benchmark numbers that matter, $1.50/$9 pricing breakdown, and what to instrument before you swap.

11 LLM APIs ranked for 2026: OpenAI, Anthropic, Google, Mistral, Together AI, Fireworks, Groq. Token pricing, context windows, latency, and how to choose.

API vs MCP in 2026: REST, gRPC, and GraphQL versus Model Context Protocol. Discovery, context streaming, security, versioning, and when to combine both.
