Choosing an LLM Observability Tool for Your Stack: 7 Questions
Seven questions for choosing an LLM observability tool that fits your existing stack: OpenTelemetry-native spans, auto-instrumentation, portable export, and eval scoring.
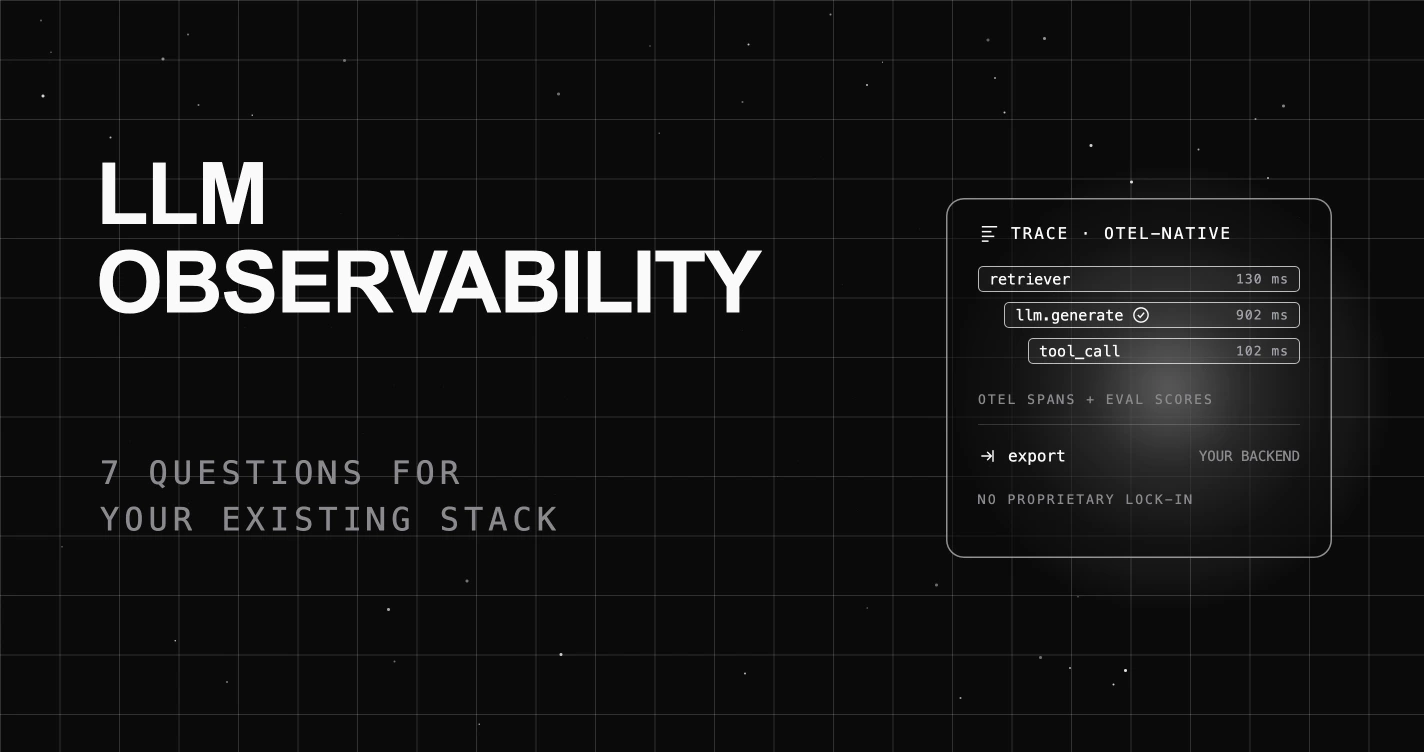
Table of Contents
Your team already runs an observability stack. There is an OpenTelemetry collector, traces flow into your warehouse, and your infrastructure monitoring watches the servers. Then you ship an LLM feature, buy a dedicated LLM observability tool on the strength of its trace-waterfall demo, and three weeks later you have a second, parallel pipeline: a proprietary agent that only reports into its own dashboard, traces you cannot join to the rest of your telemetry, and a nagging sense that you now operate two observability systems that do not talk to each other.
That is the trap for a team with an existing stack. Most LLM observability tools are bought on the demo and judged too late on the integration. The ones that fail either lock your traces into a proprietary format, require you to add their code everywhere your app calls the model, or watch latency and tokens while staying silent on whether the answer was any good. Here are the 7 questions that decide whether an LLM observability tool fits the stack you already run, and how to answer each.
TL;DR: choose an LLM observability tool that is OpenTelemetry-native (so traces route into your existing pipeline, not a silo), auto-instruments your framework without code rewrites, lets you export spans to your own backend, and attaches quality scores to spans instead of only latency and tokens. A tool that only watches the model call, or only reports into its own dashboard, adds a second stack instead of fitting the one you have.
New to the category? Start with what LLM observability is and the LLM observability platform buyer’s guide for the platform-level view. This guide is narrower: it is about fit with an existing stack.
Why choosing an LLM observability tool for an existing stack is harder than it looks
The trace-waterfall screenshot every vendor shows is real, and it is not the hard part. The hard part is everything the demo skips: whether the spans are standard or proprietary, whether you set it up once or edit code all over your app, whether the traces can leave the vendor’s dashboard, and whether the tool measures quality or just counts tokens. For a greenfield project none of this hurts much. For a team that already runs telemetry, each of those is where a tool either slots in or becomes a second system to operate.
There is also a quieter failure. Many tools sold as “LLM observability” are really just standard performance monitors (the kind that track how fast and how expensive your app is) with a token count added on top. They will tell you a call took 900 milliseconds and cost two cents, but nothing about whether the answer was actually correct, on-topic, or made up. That tells you the app is running, not whether it is doing its job well. The seven questions below are weighted toward the two things a generic buyer checklist skips: whether the tool fits your stack without lock-in, and whether it sees quality, not just cost. Treat them as a scorecard, the Existing-Stack Observability Fit Test, and a tool should clear at least five of seven before it joins your pipeline.
The 7 questions to ask before you choose
The Existing-Stack Observability Fit Test. Score each factor pass or fail. Aim for five or more.
| # | Factor | Pass if the tool… |
|---|---|---|
| 1 | Open and portable | Uses OpenTelemetry and lets you send trace data to your own systems, not just its dashboard |
| 2 | Hooks in automatically | Starts tracing your framework without editing your own code |
| 3 | Fits your existing traces | An LLM step joins the same end-to-end trace as the service that called it |
| 4 | Quality on spans | Attaches eval scores, not just latency and tokens |
| 5 | Multi-agent traces | Captures retrieval and tool-call spans, not single calls |
| 6 | Data control | Redacts sensitive fields before spans leave your environment |
| 7 | Honest scope | Is clear it does not replace your server-monitoring tools |
1. Is your trace data open and portable, or locked in?
Why it matters: an observability tool quickly becomes permanent plumbing, so being unable to get your data out of it is a real risk. If a tool stores your traces (the step-by-step records of each request) in its own private format, or will only show them inside its own dashboard, you cannot send them to your own data warehouse, line them up against the rest of your monitoring, or switch tools later without redoing everything.
What to look for: a tool that records traces using OpenTelemetry (OTel), the open standard most monitoring tools already speak, and lets you send that data to your own systems (your own collector, warehouse, or data store), not only its dashboard.
What to avoid: a tool that keeps traces in its own private format or only inside its own dashboard, with no standard way to export them anywhere else.
How FutureAGI fits: traceAI is OpenTelemetry-native and Apache 2.0. It emits standard OpenTelemetry spans with consistent conventions for prompts, answers, retrieval, and tool calls, and because they are standard OTel spans you can route them to any OpenTelemetry-compatible destination, not just a FutureAGI dashboard. You instrument with an open library rather than a closed SDK, so the data path stays yours.
2. Does it hook in automatically, or make you edit your own code?
Why it matters: if getting traces requires every engineer to add tracking code around each AI call by hand, coverage slips the moment a new service forgets to do it. Adding that code by hand across a codebase you already have is also the kind of work that stalls a rollout.
What to look for: a tool that hooks into the frameworks you already use automatically, so one setup step starts producing traces without editing the places in your code that call the model.
What to avoid: a tool that makes you manually add its code around every model call and every retrieval step.
How FutureAGI fits: traceAI auto-instruments common frameworks at import time, including OpenAI, LangChain, LlamaIndex, Groq, Portkey, and Gemini. You install the relevant package and run one setup step, and traces start flowing from your existing code without editing the places that call the model. Context managers such as using_session() and using_attributes() let you enrich spans where you want detail, but the baseline coverage does not require a rewrite. For a deeper walkthrough, see the OpenTelemetry-native tracing guide.
3. Does it connect to the traces you already have?
Why it matters: an LLM call is usually one step inside a bigger request that also touches your own services and databases. If the tool records that call as a separate, standalone trace, you cannot see it in the context of the whole request, so you lose the thread between a slow or wrong answer and everything that happened around it.
What to look for: a tool that uses the same trace context as the rest of your system, so an LLM step shows up inside the same end-to-end trace as the service that called it, not as an island.
What to avoid: a tool that records LLM calls in their own separate trace, with no link back to the request that triggered them.
How FutureAGI fits: because traceAI is built on OpenTelemetry, an LLM step carries the same trace context as your other instrumented services. When your app calls the model as part of a larger request, that step attaches to the request’s existing trace instead of starting a disconnected one, so you can follow a single request from your own service, through retrieval and the model call, to the final answer, all in one trace.
4. Does it attach quality signal to spans, or just latency and tokens?
Why it matters: for an LLM app, “the call succeeded in 800 milliseconds” can sit on top of a confidently wrong answer. If your observability tool only counts tokens and time, it is really just a performance monitor, and it will show green while quality quietly degrades.
What to look for: quality scores, such as groundedness, context relevance, or hallucination, attached to each step of the trace, ideally measured on live traffic.
What to avoid: a tool whose only signals are latency, tokens, and cost, with nothing about whether the answer was right.
How FutureAGI fits: with traceAI you pick which quality checks to run when you set up tracing, and fi.evals attaches their scores to each step, so a groundedness or context-relevance score sits right next to the latency and token count. Production spans are sampled and scored after they export, so scoring adds no latency to the user path, and you get a quality read on live traffic rather than only on a static test set. For where these two layers meet, read LLM eval versus LLM observability.
5. Does it capture multi-agent and tool-call traces, not just single calls?
Why it matters: a modern LLM app is rarely one call. It retrieves, calls tools, and orchestrates sub-agents. If your tool wraps only the top-level model client, the retrieval and tool spans where failures actually start are invisible.
What to look for: a trace tree that captures retrieval, tool invocation, and sub-agent spans in one end-to-end trace, with the failing span identifiable in context.
What to avoid: a tool that records only the top-level model call and lumps everything underneath it, the retrieval and tool steps, into one block you cannot read.
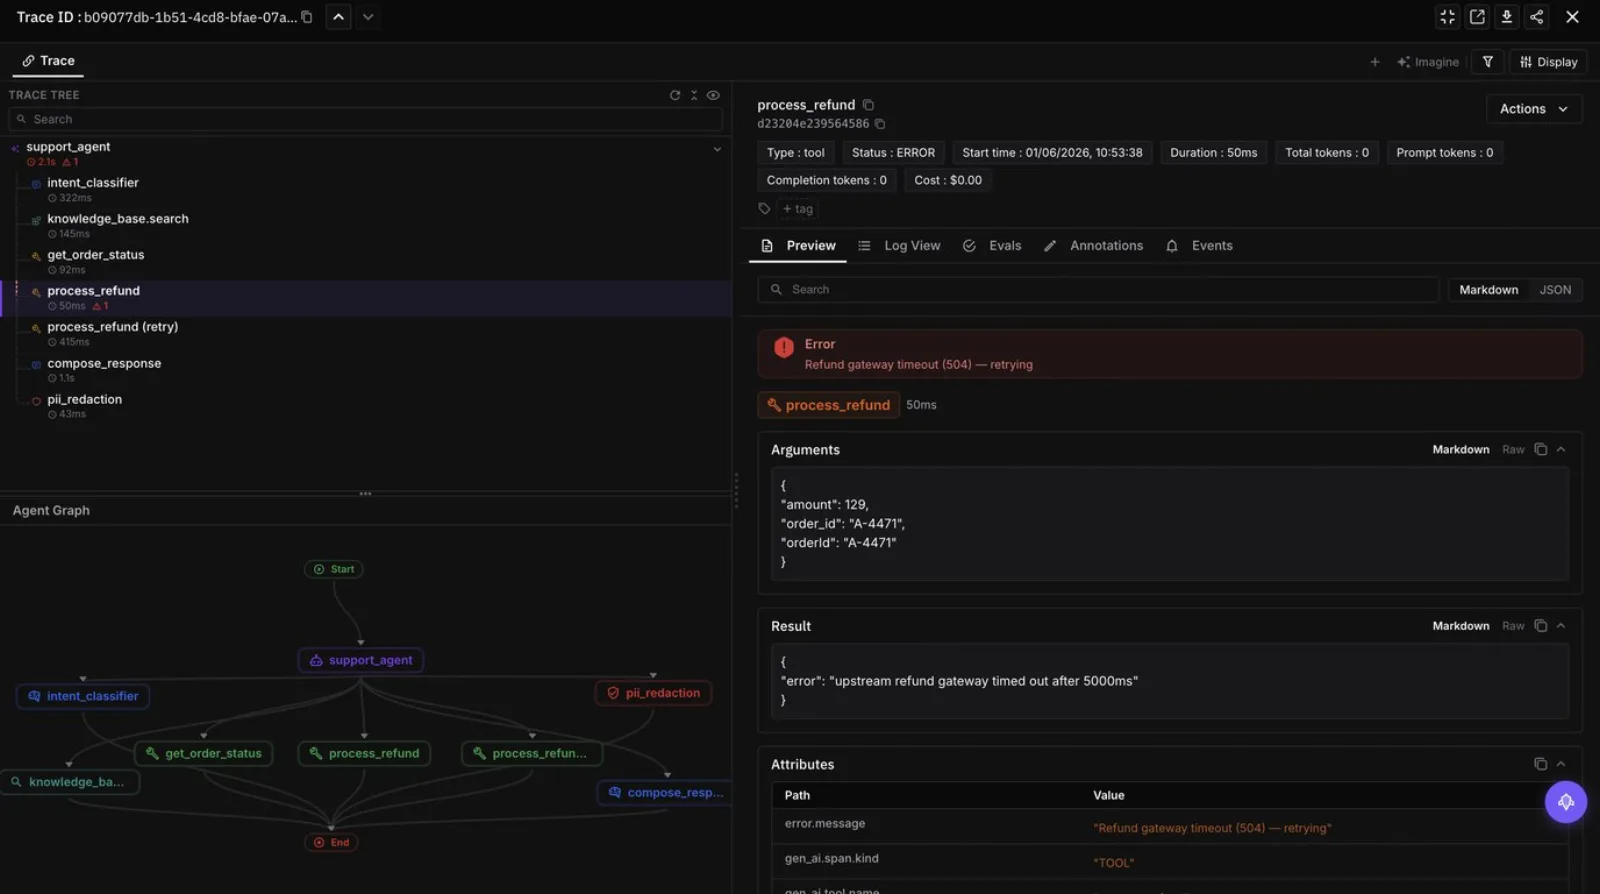
How FutureAGI fits: traceAI captures retrieval, tool calls, and multi-agent spans as first-class nodes in the trace tree, with an agent graph of the run. When a tool call fails, for example a downstream timeout on a refund step, you see the failing span with its arguments and error in the context of the whole trace, not a single latency number for the outer call. That is the difference between debugging with the evidence present and debugging with it folded away.
6. Does it keep sensitive fields out of exported spans?
Why it matters: spans carry prompts and answers, which often contain personal or sensitive data. If everything is exported raw, your observability pipeline becomes a place sensitive data leaks into.
What to look for: configurable redaction of sensitive fields on span attributes before export.
What to avoid: a tool that ships prompts and answers verbatim with no masking option.
How FutureAGI fits: traceAI can automatically hide sensitive fields such as email, phone, SSN, and API keys in the trace data before it is sent out, so those values do not leave your environment in plain text. One limit to keep in mind: this masking is one safeguard, not your whole data-protection setup. You still handle encryption, access control, and how long data is kept wherever the traces land. Treat it as reducing what shows up in your telemetry, not as a replacement for the rest of your data governance.
7. Will it replace your infrastructure monitoring, or sit alongside it?
Why it matters: LLM observability and infrastructure monitoring solve different problems. A tool that claims to do both usually does one of them badly, and you need an honest read on the boundary so you do not end up with a gap or a redundant spend.
What to look for: a tool that is clear about its scope, the model and retrieval behavior, and works alongside your existing server-monitoring tools rather than pretending to replace them.
What to avoid: marketing that positions an LLM quality tool as a full-stack replacement for your metrics, logs, and infrastructure traces.
How FutureAGI fits: traceAI watches your AI layer, not your servers. It shows which prompt produced which answer, whether retrieval pulled the right context, and whether the answer was grounded. It does not replace your server-monitoring tools for things like CPU, memory, and uptime. The right setup runs both: your usual infrastructure monitoring for the machine, and FutureAGI for the model behavior it cannot see. If all you need is standard infrastructure metrics, you do not need this kind of tool at all.
A quick decision framework
The seven factors are the test; here is how the answers map to a pick.
| Choose | When | What decides it |
|---|---|---|
| An OpenTelemetry-native tool | You already run an OTel pipeline and cannot afford a second, siloed one | Factors 1, 3 |
| A tool with auto-instrumentation | You are adding observability to an existing codebase, not a greenfield app | Factor 2 |
| A tool that scores quality on spans | Your failures are “right latency, wrong answer,” not just slow calls | Factor 4 |
| A tool with deep multi-agent tracing | Your app retrieves, calls tools, and orchestrates sub-agents | Factor 5 |
| A standard server-monitoring tool instead | You only need CPU, uptime, and latency, with no question about answer quality | You do not need the LLM observability category at all |
Where FutureAGI fits
The seven factors get you traces that fit your stack and carry a quality score. In production the score is the start, not the end, and three things FutureAGI does past the fit checklist are what make it worth adding to a stack you already run.
Failures cluster by root cause, not one trace at a time. At production volume a low groundedness score is not rare, you get hundreds. FutureAGI’s Error Feed groups failing spans into failure modes by similarity, so a recurring pattern shows up as one cluster to fix rather than 500 traces to read by hand. That is the difference between a trace viewer and a tool that tells you what to work on next.
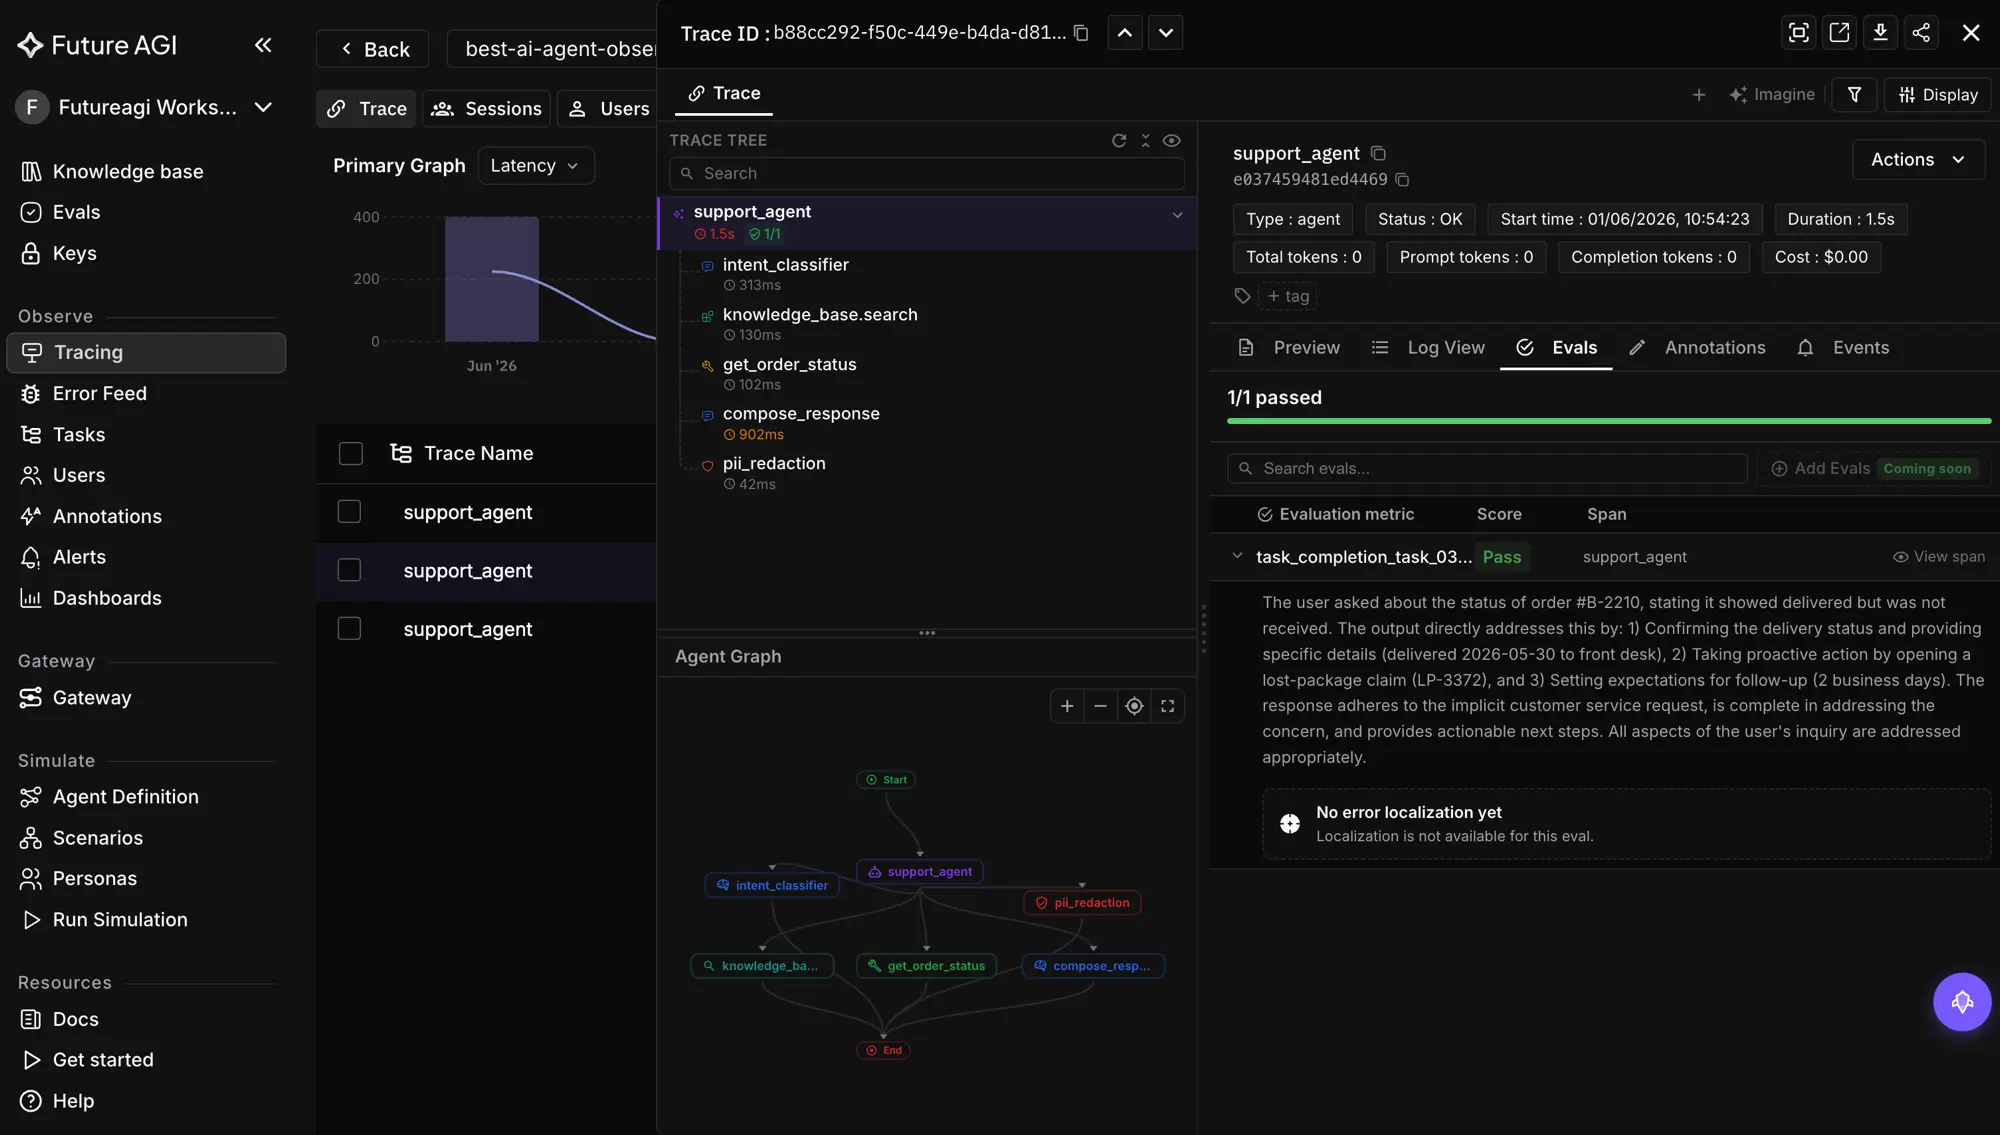
The same rubric runs offline and online. The groundedness and context_relevance evaluators that gate your CI pipeline are the exact ones scoring production spans through traceAI. A green pre-ship score means the same thing in production, so you are not comparing a strict offline metric against a looser live one, which is a common trap when eval and observability are two disconnected tools.
The judge stays calibrated as your app changes. Low-confidence and low-scoring spans route to annotation queues for human review, and those labels feed back to retune the evaluators. The quality scores keep tracking what your reviewers would say as prompts and data shift underneath them, which a fixed scorer added onto a plain performance monitor cannot do.
If the seven factors map to your stack, the fastest test is to instrument one endpoint and watch the spans score themselves. See the FutureAGI observability docs, the evaluation platform, and the open-source traceAI library.
What to read next
- The Ultimate Guide to LLM Observability (2026): the full definition and stack picture, if you are scoping the category.
- The LLM Observability Platform Buyer’s Guide (2026): the platform-level comparison view, one level up from this fit checklist.
- LLM App Observability with OpenTelemetry (2026): the OTel-native instrumentation path in practice, for the engineer wiring it in.
- LLM Eval vs LLM Observability (2026): how the scoring layer and the tracing layer fit together, if the two keep blurring for your team.
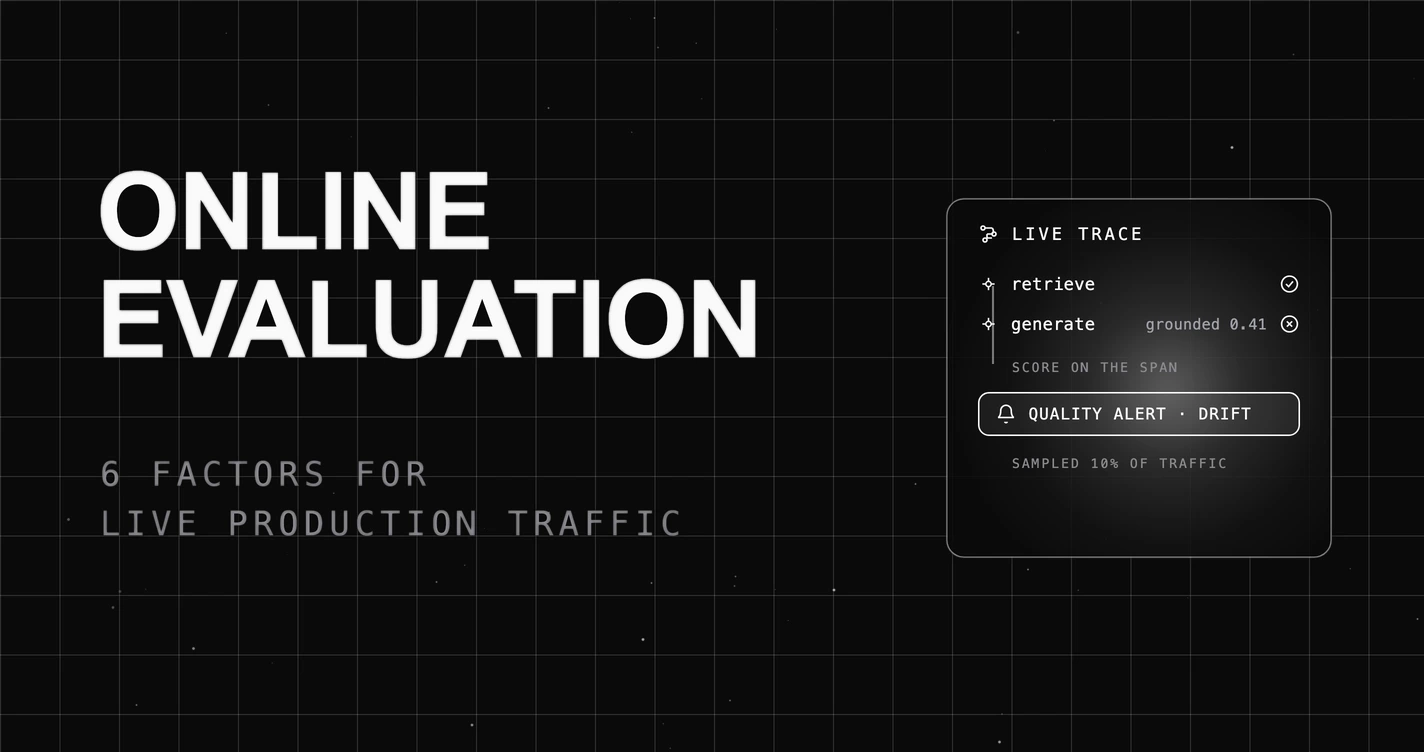
Six factors for choosing an online evaluation platform for live production traffic: scoring on the trace, sampling at scale, quality alerts, and root cause.

A 7-factor guide to choosing a RAG observability tool: retriever-span tracing, retrieval-vs-generation attribution, and ground-truth-free scoring.

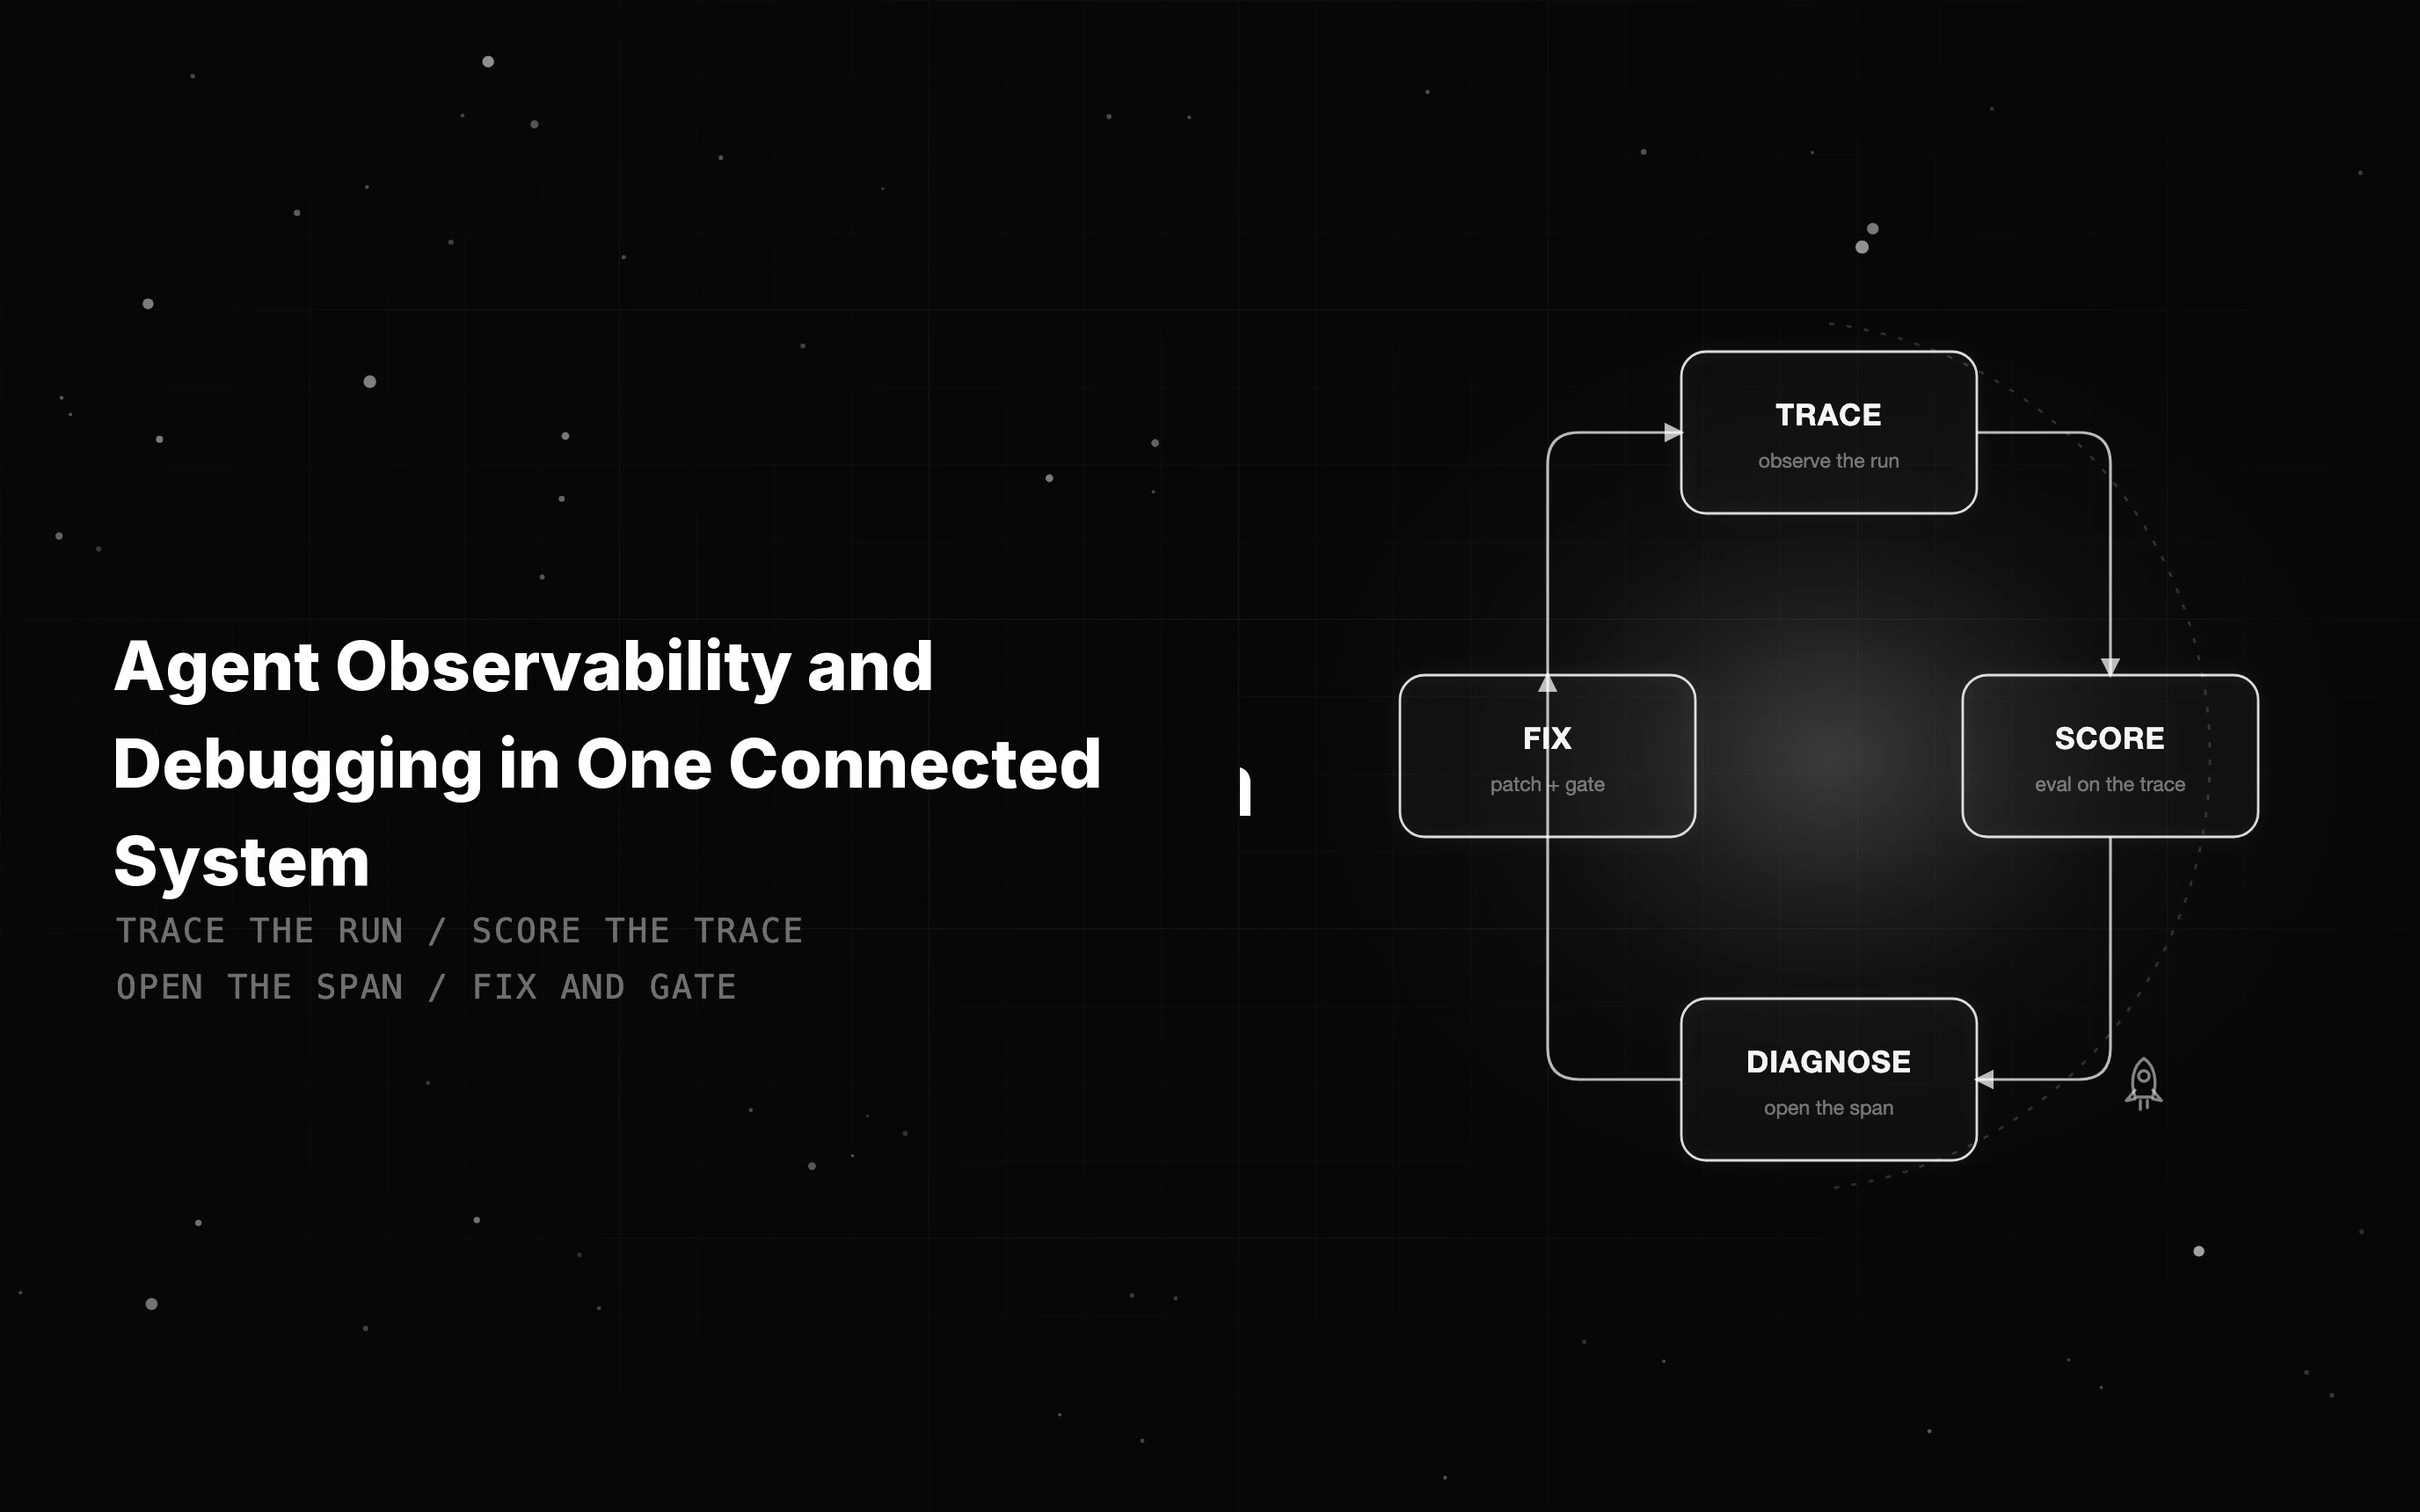
Agent observability shows what an agent did; debugging fixes it. See what to instrument and how tracing, evals, and fixes meet on one trace to close the gap.