Bedrock AgentCore Observability for Strands Agents With OpenTelemetry
Bedrock AgentCore observability sends Strands spans to CloudWatch by default. See what ADOT captures, what CLI 1.0 changed, and how to run evals on those spans.
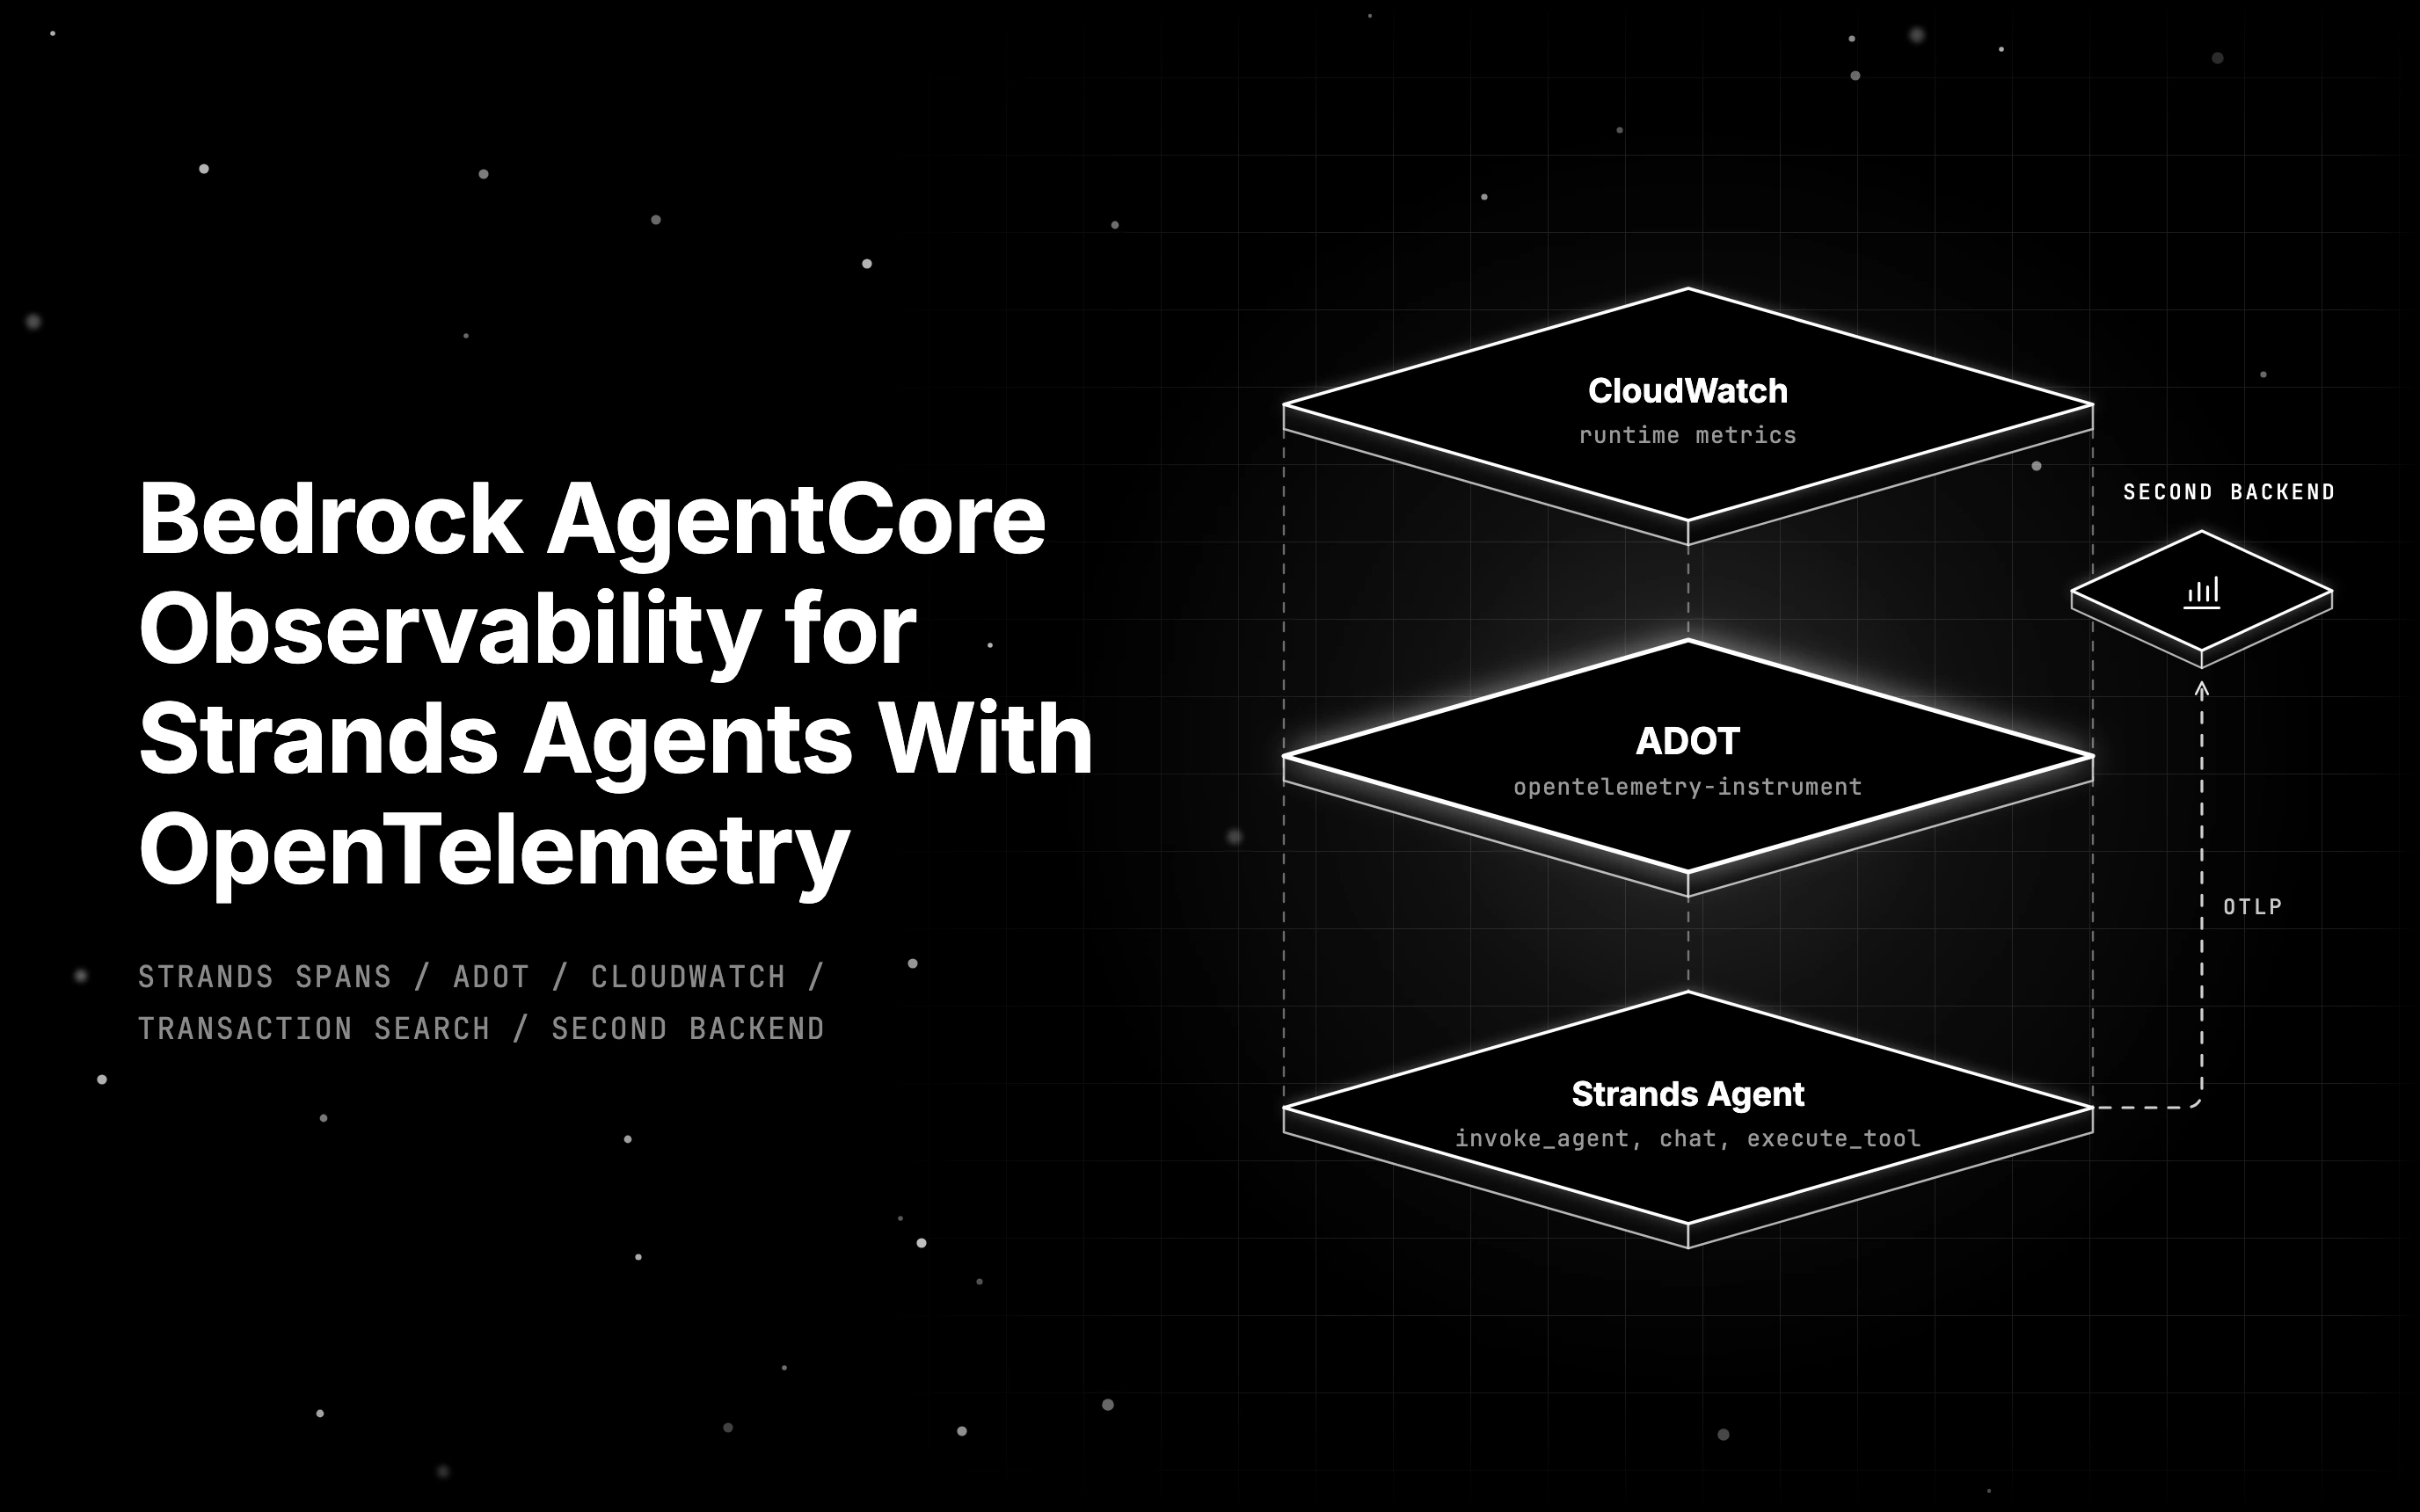
Table of Contents
A customer asks your Strands agent on AgentCore Runtime “What does the team plan cost per seat?” and gets back a polite apology. Bedrock AgentCore observability shows the whole run in CloudWatch: one trace, a completed tool span, normal latency, token counts on every model call. Nothing on that screen says the customer never got a price.
The failure is small. The model passed “team” to a get_plan_price tool, the price table is keyed “Team”, and the tool returned its “unknown plan” fallback. The agent said it could not find that plan, and every span finished with status OK, because nothing crashed.
Bedrock AgentCore observability tells you what ran and how long it took; you still need something that scores whether the answer was right. This guide covers AgentCore’s defaults, what AgentCore CLI 1.0 changed, how the same Strands spans reach a second backend, and where an eval runs on them.
TL;DR
- Bedrock AgentCore observability gives CloudWatch runtime metrics with no code; Strands model and tool spans need the AWS Distro for OpenTelemetry (ADOT).
- AgentCore CLI 1.0 went GA on October 28, 2026; deploys enable Transaction Search by default and start agents under
opentelemetry-instrumentunlessenableOtelis false (code-zip) or the DockerfileCMDdrops the wrapper (container). - Strands emits
invoke_agent,execute_event_loop_cycle,chatandexecute_toolspans that any OTLP backend can receive. - One global tracer provider per process means two supported wirings: a single tracing owner, or a collector fan-out.
- Future AGI receives them through traceai-strands and scores agent spans with Task Completion.
What Bedrock AgentCore Observability Gives You by Default
Bedrock AgentCore observability gives every agent on AgentCore Runtime a set of CloudWatch metrics with no code changes: invocations, latency, session count, throttles and errors, batched each minute. Model, tool and token spans from inside your agent appear only after the code runs under the AWS Distro for OpenTelemetry, which the AgentCore CLI adds for you.
AWS describes three pillars: tracing and telemetry, metrics and monitoring, and audit logging, with CloudTrail recording API activity for Gateway and Agent Registry. All metrics, spans and logs land in Amazon CloudWatch, in an OpenTelemetry-compatible format you can export to other tools.
The pillars are laid out in the AgentCore observability overview.
Enable tracing on the runtime resource and AgentCore adds one service span per call, InvokeAgentRuntime, with attributes such as session.id and latency_ms. Application logs carry the request payload but not the response. Neither shows what the model or a tool did inside your code.
Metric names, span attributes and log fields are listed on the AgentCore runtime metrics reference.
| Signal | On by default | What turns it on | Where it lands |
|---|---|---|---|
| Runtime metrics | Yes | Nothing | CloudWatch metrics, bedrock-agentcore namespace |
InvokeAgentRuntime service span | No | Runtime tracing plus Transaction Search | Agent log group or aws/spans |
| Application logs | No | Log delivery enabled on the runtime | CloudWatch Logs, Amazon S3 or Firehose |
| Strands agent, model and tool spans | No | ADOT via opentelemetry-instrument, default for CLI deploys | Agent log group or aws/spans |
Runtime Metrics You Get Without Touching Code
The runtime metrics include Invocations, Throttles, System Errors, User Errors, Latency and Session Count, batched each minute under the bedrock-agentcore namespace in CloudWatch Metrics. For platform version V2 agents, OverheadLatency in the AWS/Bedrock-AgentCore namespace counts platform time up to your agent’s first response byte.
Where AgentCore Observability OpenTelemetry Data Lands
In supported Regions, newly created agents write spans to the spans stream of their own log group, /aws/bedrock-agentcore/runtimes/<agent_id>-<endpoint_name>. Older agents keep the shared aws/spans group. The UNIFIED_TRACES_DESTINATION_ENABLED variable switches an agent either way, and the per-agent destination needs ADOT 0.18.0 or later.
Spans only become searchable once CloudWatch Transaction Search is on. It indexes 1% of traces at no cost, and you can raise that percentage later. After first enablement, AWS says spans can take ten minutes to become available for search and analysis.
The span destination rules and the DISABLE_ADOT_OBSERVABILITY setting are documented on the AgentCore page for adding observability.
AgentCore CLI 1.0 and What It Changed for Deploys
AWS made AgentCore CLI 1.0 generally available on October 28, 2026 as the @aws/agentcore 1.0.0 npm package. It is a rebuild with faster startup and a consistent command set, and for observability the change that matters is that agentcore deploy now turns on CloudWatch Transaction Search by default, with an opt-out.
The date and package name come from the AgentCore CLI 1.0 announcement.
The CLI first reached GA as v0.4.0 in March 2026, so 1.0 rebuilds a tool teams already use. Commands like deploy, invoke, traces and eval remain, projects ship a thin CDK app on @aws/agentcore-cdk, and agentcore config transactionSearch false opts out of Transaction Search. The latest release is v1.0.2, as of 2026-11-11.
Each change is listed in the AgentCore release notes.
The enableOtel Switch and the opentelemetry-instrument Wrapper
In the CLI’s v1 project schema, each runtime has an instrumentation.enableOtel field that defaults to true. The opentelemetry-instrument wrapper it controls is what registers ADOT’s global tracer provider before your module loads. For a code-zip deploy, setting it to false in agentcore/agentcore.json starts the agent as plain Python.
The field and its default are defined in the AgentCore CLI runtime schema.
Container builds work differently. The CLI scaffolds the Strands Dockerfile with CMD ["opentelemetry-instrument", "python", "-m", "main"], and a container deploy runs your image as built, so the flag alone does not change it. Edit that line to CMD ["python", "-m", "main"] before you deploy.
The scaffolded start command lives in the Strands Dockerfile template in the AgentCore CLI source.
Moving a v0 Project to the v1 Format
CLI 1.0 hands v0 project deploys to the v0 CLI, but add and remove need the v1 format. agentcore migrate shows a read-only plan first, checks git and CDK, refactors the CloudFormation stack per deployment target, keeps v0 physical resource names, and can resume an interrupted migration.
A Strands Agent on Amazon Bedrock AgentCore With the Default CloudWatch View
A Strands agent on Amazon Bedrock AgentCore needs an entrypoint, a model and one tool to produce a useful trace. Deploy it with the AgentCore CLI, invoke it once, and the GenAI Observability page in CloudWatch shows the session, the trace and each span under Overview, Sessions, Traces and Spans tabs.
The AWS flow runs agentcore create and agentcore add runtime --language python --protocol HTTP, then adds aws-opentelemetry-distro, bedrock-agentcore[strands-agents] and strands-agents. The entrypoint wraps a BedrockAgentCoreApp around a BedrockModel on global.anthropic.claude-sonnet-4-6, and agentcore deploy followed by agentcore invoke --runtime <name> --payload runs it.
The project commands and dashboard tabs follow the AWS guide to getting started with AgentCore Observability.
Our agent adds one tool, get_plan_price(plan), over two plans. Ask “What does the team plan cost per seat?” and, in the case examined here, the model passes “team” and the lookup misses. CloudWatch shows a completed trace with normal latency. A live model may retry with “Team” and recover, so bad runs hide among good ones.
How Strands Agents Tracing Builds the Span Tree
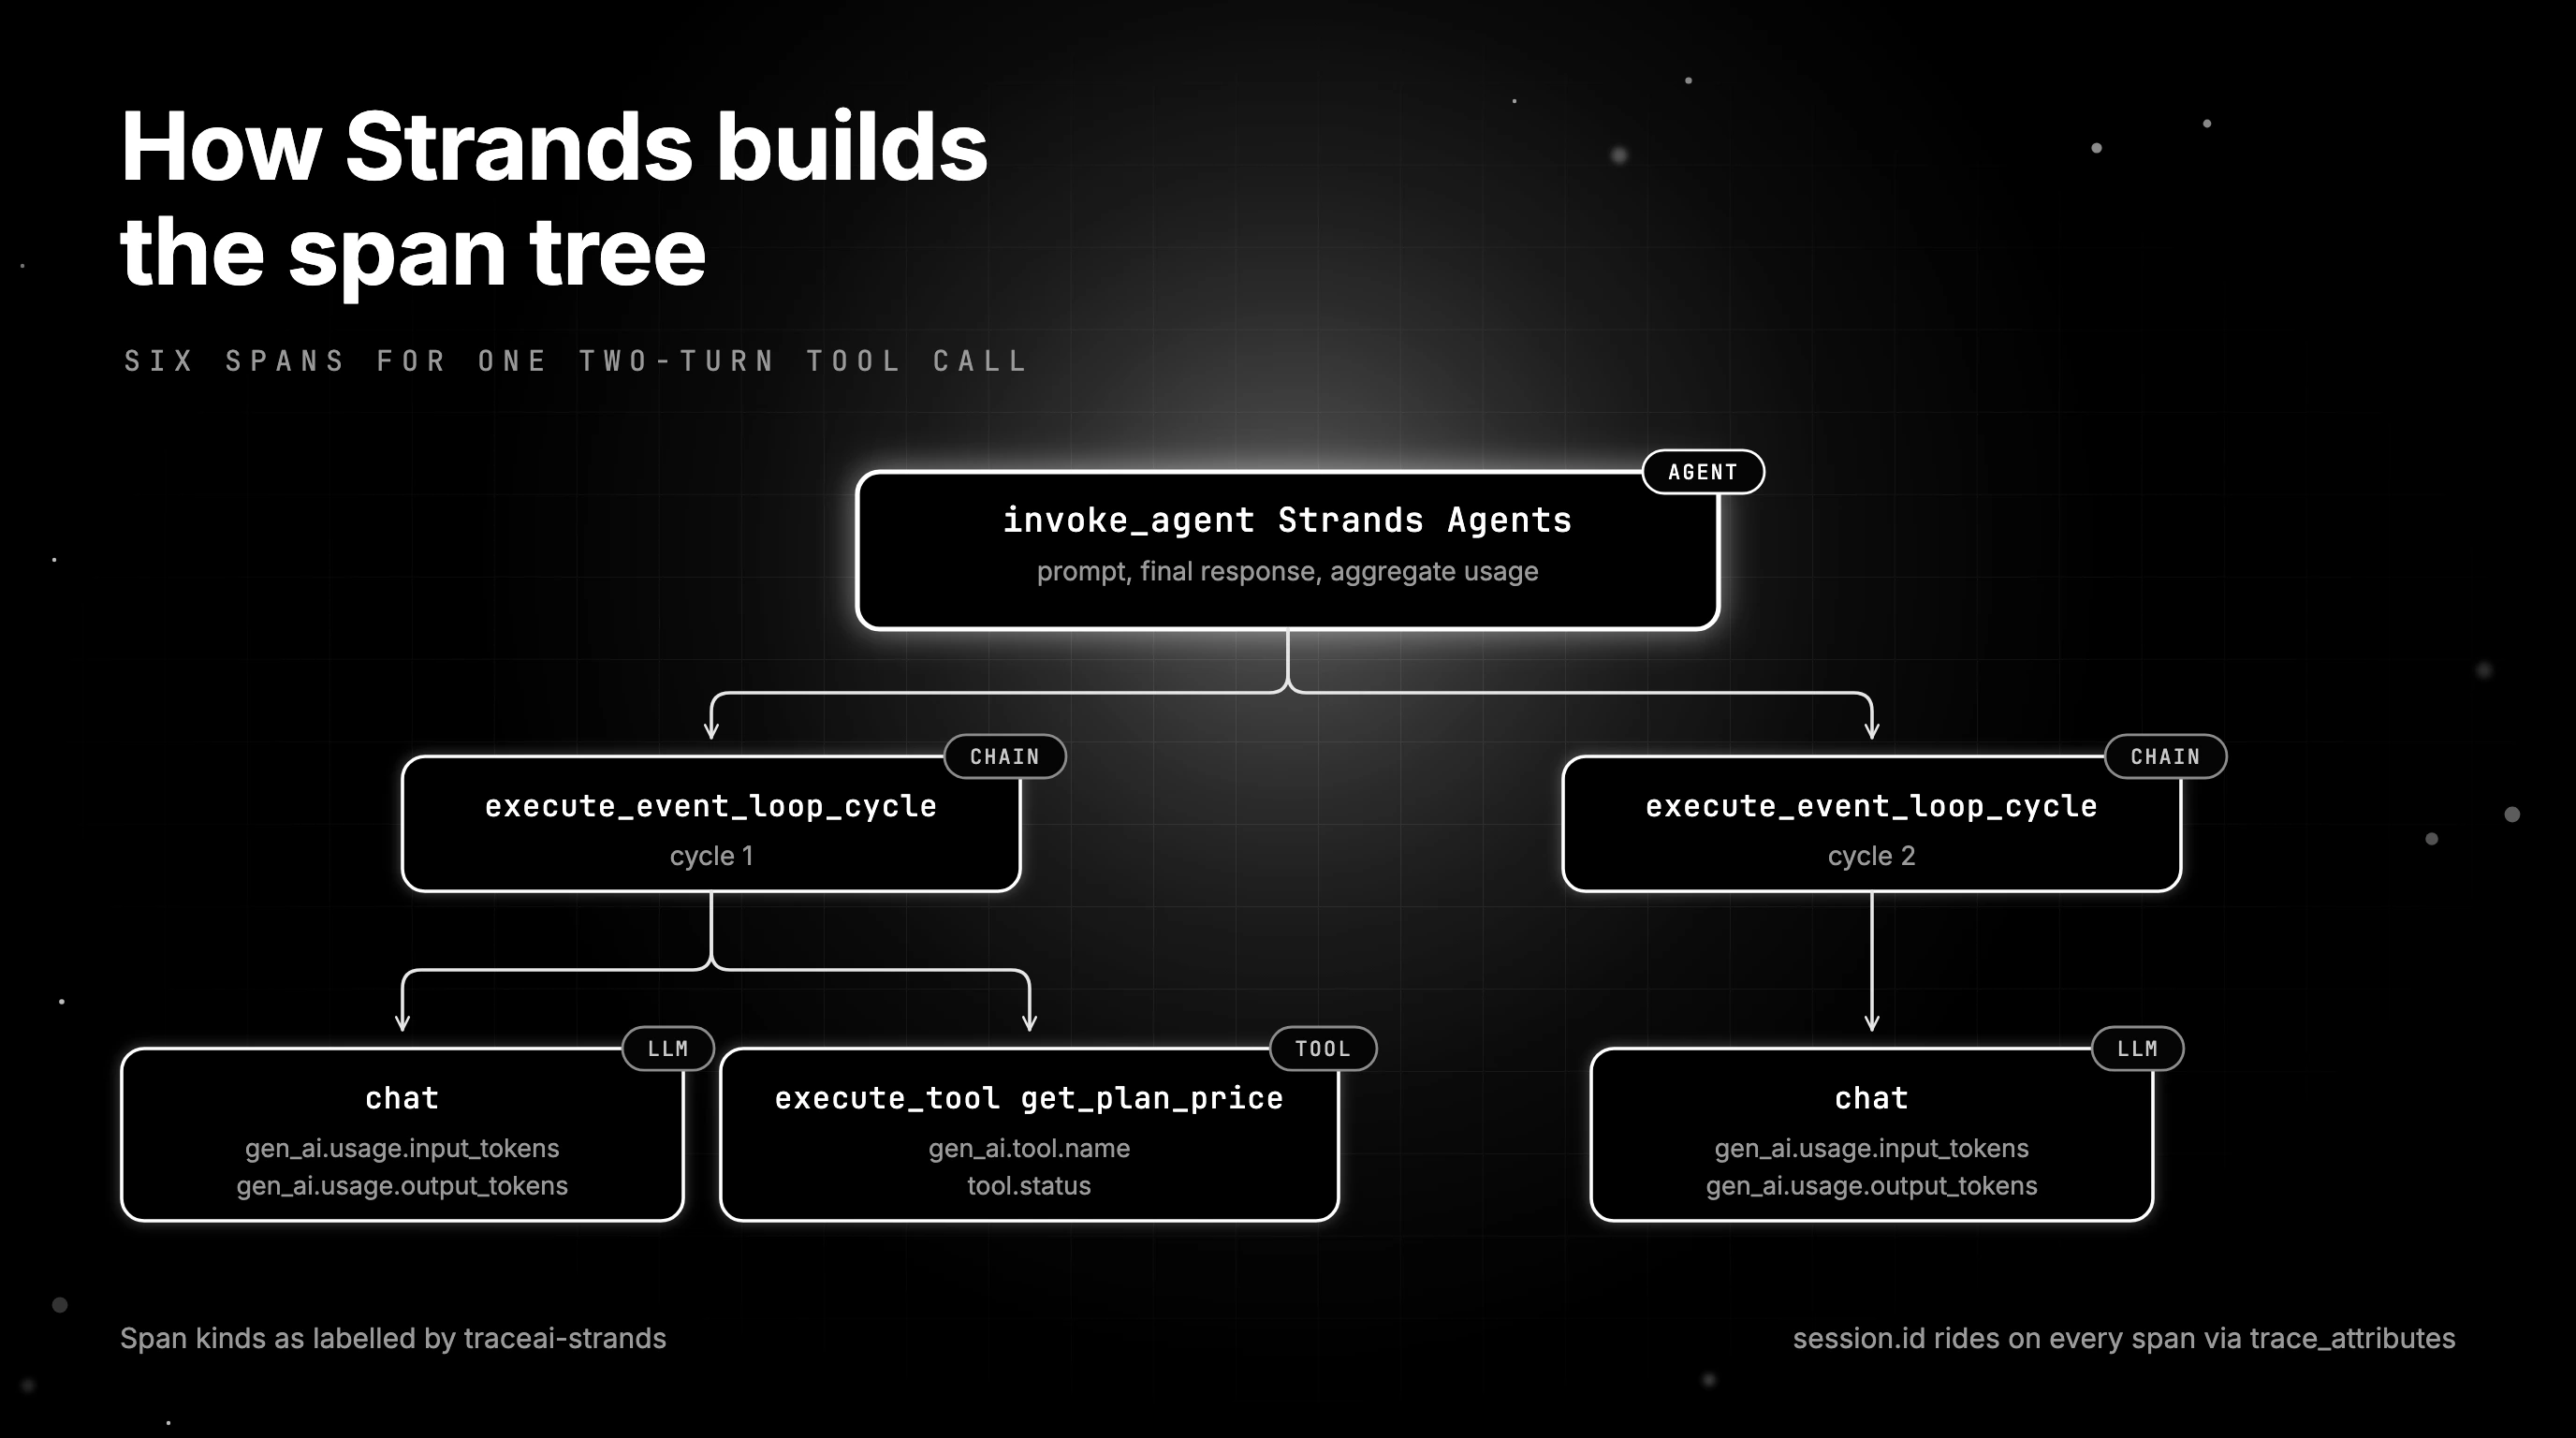
Strands creates its spans from whatever global OpenTelemetry tracer provider exists when the Agent is built. Each call produces an agent span with the prompt, final response and aggregate token usage, one execute_event_loop_cycle span per cycle, chat spans with gen_ai.usage.input_tokens and gen_ai.usage.output_tokens, and execute_tool spans with gen_ai.tool.name, gen_ai.tool.call.id and tool.status.
The full attribute list is in the Strands documentation on traces.
You attach a session through trace_attributes={"session.id": ...} on the Agent. For a two-turn tool call, the tree has six spans: the agent span, two cycles, a chat and an execute_tool get_plan_price in the first cycle, and a final chat in the second. The script later in this post prints that tree.
Reading Sessions, Traces and Spans in the GenAI Observability Page
A session holds many traces, a trace is one request and response cycle, and a span is one unit of work. In Transaction Search you filter by service name to find the trace. AgentCore passes the session in the X-Amzn-Bedrock-AgentCore-Runtime-Session-Id header, and BedrockAgentCoreApp exposes it as context.session_id.
Sending OpenTelemetry Strands Agents Spans to a Second Backend
OpenTelemetry Strands Agents spans can reach any OTLP backend, but a process gets one global tracer provider, and on AgentCore ADOT registers it first. Two wirings are supported: make your second backend the single tracing owner with the ADOT wrapper off, or export OTLP to a collector that sends copies to CloudWatch and that backend.
The single-owner wiring sets instrumentation.enableOtel to false and the runtime variable DISABLE_ADOT_OBSERVABILITY=true, which unsets AgentCore’s default ADOT variables. Runtime metrics stay in CloudWatch. The model and tool spans from your code stop reaching the GenAI view, because ADOT no longer exports them.
The collector wiring keeps both views. Your agent exports OTLP to an OpenTelemetry Collector, which sends one copy to CloudWatch’s traces endpoint, https://xray.<region>.amazonaws.com/v1/traces, authenticated with SigV4 (recommended) through the sigv4authextension, and another to the second backend. The price is one more component to run.
The endpoint format and authentication options are on the CloudWatch OTLP endpoint page.
Pipelines, processors and exporters inside the collector are covered in our guide to setting up an OTel Collector for LLM traces with sampling and redaction.
| Wiring | Tracer provider owner | In-code spans in CloudWatch | Spans in the second backend | Trade-off |
|---|---|---|---|---|
| Future AGI as single owner via traceai-strands | Future AGI register() | No; runtime metrics stay | Yes, projected by the adapter | ADOT wrapper off |
| Collector fan-out over OTLP, supported | Your SDK provider | Yes, via the OTLP endpoint with SigV4 | Yes, as raw spans | One more component; set project_name and project_type on the SDK resource, as register() does |
| Extra span processor on ADOT’s provider, undocumented | ADOT | Yes | Not documented for AgentCore | Undocumented by AWS or Future AGI |
Why a Second Tracer Provider Receives Nothing
OpenTelemetry sets the global provider once per process, so a later set_tracer_provider call logs “Overriding of current TracerProvider is not allowed” and keeps ADOT’s. Strands reads the global provider when it builds its tracer, so yours is never asked for spans. Calling StrandsTelemetry(tracer_provider=provider).setup_otlp_exporter() inside the handler adds another batch processor on every request.
One Span Stream, Two Exporters
This script uses the third mechanism from the table, an extra span processor on an existing provider, to show what the StrandsSpanExporter projection changes. It is not a deployment recipe. The stand-in provider is not ADOT, and it carries the Future AGI resource attributes by hand, with a capture exporter on each side.
A Model subclass scripts a two-turn get_plan_price call twice, first with “Team” and then with “team”. It ran with strands-agents 1.64.0, traceai-strands 0.1.2 and opentelemetry-sdk 1.45.2 on 2026-11-11, and the full output after the script is copied from that run.
"""One OTel provider, Strands spans fanned out to two exporters.

Exporter A stands in for the CloudWatch path that ADOT owns on AgentCore.
Exporter B is traceai-strands' StrandsSpanExporter, the Future AGI path, wrapping
a capture exporter in place of HTTPSpanExporter.
The model is a subclass of strands.models.Model that scripts two turns.
The stand-in provider is NOT ADOT: it is given the Future AGI project_name and
project_type resource attributes by hand, which ADOT's provider does not set.
"""
import importlib.metadata as md

from opentelemetry import trace
from opentelemetry.sdk.resources import Resource
from opentelemetry.sdk.trace import TracerProvider
from opentelemetry.sdk.trace.export import SimpleSpanProcessor
from opentelemetry.sdk.trace.export.in_memory_span_exporter import InMemorySpanExporter
from traceai_strands import StrandsSpanExporter

# Stand-in provider (not ADOT). AWS does not document adding a processor to ADOT's provider.
provider = TracerProvider(resource=Resource.create({
    "service.name": "strands-agentcore-demo",
    "project_name": "strands-agentcore-demo",
    "project_type": "observe",
}))
cloudwatch_side = InMemorySpanExporter()
provider.add_span_processor(SimpleSpanProcessor(cloudwatch_side))
trace.set_tracer_provider(provider)

# Second exporter on the same provider: shows what the StrandsSpanExporter projection changes.
futureagi_side = InMemorySpanExporter()
trace.get_tracer_provider().add_span_processor(
    SimpleSpanProcessor(StrandsSpanExporter(futureagi_side, capture_content=True))
)

from strands import Agent, tool  # import after the provider exists
from strands.models import Model


class ScriptedModel(Model):
    """Turn 1 asks for get_plan_price, turn 2 answers from the tool result."""

    def __init__(self, plan="Team"):
        self.turn = 0
        self.plan = plan

    def get_config(self):
        return {"model_id": "scripted-model"}

    def update_config(self, **kwargs):
        raise NotImplementedError("wire a real model config here")

    async def structured_output(self, *args, **kwargs):
        raise NotImplementedError("wire structured output here")
        yield  # pragma: no cover

    async def stream(self, messages, tool_specs=None, system_prompt=None, **kwargs):
        self.turn += 1
        yield {"messageStart": {"role": "assistant"}}
        if self.turn == 1:
            yield {"contentBlockStart": {"start": {"toolUse": {"toolUseId": "t1", "name": "get_plan_price"}}}}
            yield {"contentBlockDelta": {"delta": {"toolUse": {"input": '{"plan": "%s"}' % self.plan}}}}
            yield {"contentBlockStop": {}}
            yield {"messageStop": {"stopReason": "tool_use"}}
        else:
            tool_text = messages[-1]["content"][0]["toolResult"]["content"][0]["text"]
            text = (f"Sorry, I could not find a plan called {self.plan}." if tool_text == "unknown plan"
                    else f"The Team plan costs {tool_text}.")
            yield {"contentBlockDelta": {"delta": {"text": text}}}
            yield {"contentBlockStop": {}}
            yield {"messageStop": {"stopReason": "end_turn"}}
        yield {"metadata": {"usage": {"inputTokens": 40, "outputTokens": 12, "totalTokens": 52},
                            "metrics": {"latencyMs": 5}}}


PRICE_TABLE = {"Starter": "$12 per seat per month", "Team": "$24 per seat per month"}


@tool
def get_plan_price(plan: str) -> str:
    """Return the list price for a plan from the price table."""
    return PRICE_TABLE.get(plan, "unknown plan")


agent = Agent(model=ScriptedModel(), tools=[get_plan_price], callback_handler=None,
              trace_attributes={"session.id": "demo-session-1"})
result = agent("What does the Team plan cost per seat?")
provider.force_flush()

print("versions:", {p: md.version(p) for p in ("strands-agents", "traceai-strands", "opentelemetry-sdk")})
print("answer:", str(result).strip())
for label, exp in (("cloudwatch_side", cloudwatch_side), ("futureagi_side", futureagi_side)):
    spans = exp.get_finished_spans()
    print(f"{label}: {len(spans)} spans -> {[s.name for s in spans]}")

same_ids = sorted(s.context.span_id for s in cloudwatch_side.get_finished_spans()) == \
    sorted(s.context.span_id for s in futureagi_side.get_finished_spans())
print("same span ids on both sides:", same_ids)
for s in futureagi_side.get_finished_spans():
    keys = sorted(k for k in s.attributes if "token" in k or k.startswith(("fi.", "llm.", "tool.")) or k == "gen_ai.tool.name")
    print(f"  FAGI {s.name}: {keys[:8]}")
assert same_ids
assert "$24 per seat" in str(result)

# Token usage: raw Strands repeats totals on the agent span; the adapter keeps them on model spans.
raw_agent = [s for s in cloudwatch_side.get_finished_spans() if s.name.startswith("invoke_agent")][0]
fagi_agent = [s for s in futureagi_side.get_finished_spans() if s.name.startswith("invoke_agent")][0]
print("raw agent span total_tokens:", raw_agent.attributes.get("gen_ai.usage.total_tokens"))
print("FAGI agent span total_tokens:", fagi_agent.attributes.get("gen_ai.usage.total_tokens"))
print("FAGI span kinds:", sorted({str(s.attributes.get("gen_ai.span.kind")) for s in futureagi_side.get_finished_spans()}))

# Run 2: the lookup miss. The model passes "team"; the table key is "Team".
cloudwatch_side.clear(); futureagi_side.clear()
miss = Agent(model=ScriptedModel(plan="team"), tools=[get_plan_price], callback_handler=None,
             trace_attributes={"session.id": "demo-session-2"})
miss_result = miss("What does the team plan cost per seat?")
provider.force_flush()
print("--- run 2: lookup miss ---")
print("answer:", str(miss_result).strip())
spans = futureagi_side.get_finished_spans()
print("futureagi_side:", len(spans), "spans, status codes:", sorted({s.status.status_code.name for s in spans}))
tool_span = [s for s in spans if s.name == "execute_tool get_plan_price"][0]
print("tool span output.value:", tool_span.attributes.get("output.value"))
agent_span = [s for s in spans if s.name.startswith("invoke_agent")][0]
print("agent span input.value:", agent_span.attributes.get("input.value"))
print("agent span output.value:", agent_span.attributes.get("output.value"))
assert "could not find" in str(miss_result)
versions: {'strands-agents': '1.64.0', 'traceai-strands': '0.1.2', 'opentelemetry-sdk': '1.45.2'}
answer: The Team plan costs $24 per seat per month.
cloudwatch_side: 6 spans -> ['chat', 'execute_tool get_plan_price', 'execute_event_loop_cycle', 'chat', 'execute_event_loop_cycle', 'invoke_agent Strands Agents']
futureagi_side: 6 spans -> ['chat', 'execute_tool get_plan_price', 'execute_event_loop_cycle', 'chat', 'execute_event_loop_cycle', 'invoke_agent Strands Agents']
same span ids on both sides: True
FAGI chat: ['gen_ai.usage.input_tokens', 'gen_ai.usage.output_tokens', 'gen_ai.usage.total_tokens']
FAGI execute_tool get_plan_price: ['gen_ai.tool.name']
FAGI execute_event_loop_cycle: []
FAGI chat: ['gen_ai.usage.input_tokens', 'gen_ai.usage.output_tokens', 'gen_ai.usage.total_tokens']
FAGI execute_event_loop_cycle: []
FAGI invoke_agent Strands Agents: []
raw agent span total_tokens: 104
FAGI agent span total_tokens: None
FAGI span kinds: ['AGENT', 'CHAIN', 'LLM', 'TOOL']
--- run 2: lookup miss ---
answer: Sorry, I could not find a plan called team.
futureagi_side: 6 spans, status codes: ['OK']
tool span output.value: [{"role": "tool", "content": [{"text": "unknown plan"}]}]
agent span input.value: [{"role": "user", "content": [{"text": "What does the team plan cost per seat?"}]}]
agent span output.value: [{"role": "assistant", "content": "Sorry, I could not find a plan called team.\n"}]Both sides hold the same six span IDs. On the raw side, the agent span repeats the run’s 104 total tokens, the two chat spans’ 52 each summed. That duplicate is the behavior reported in the open Strands issue on token usage attached to container spans.
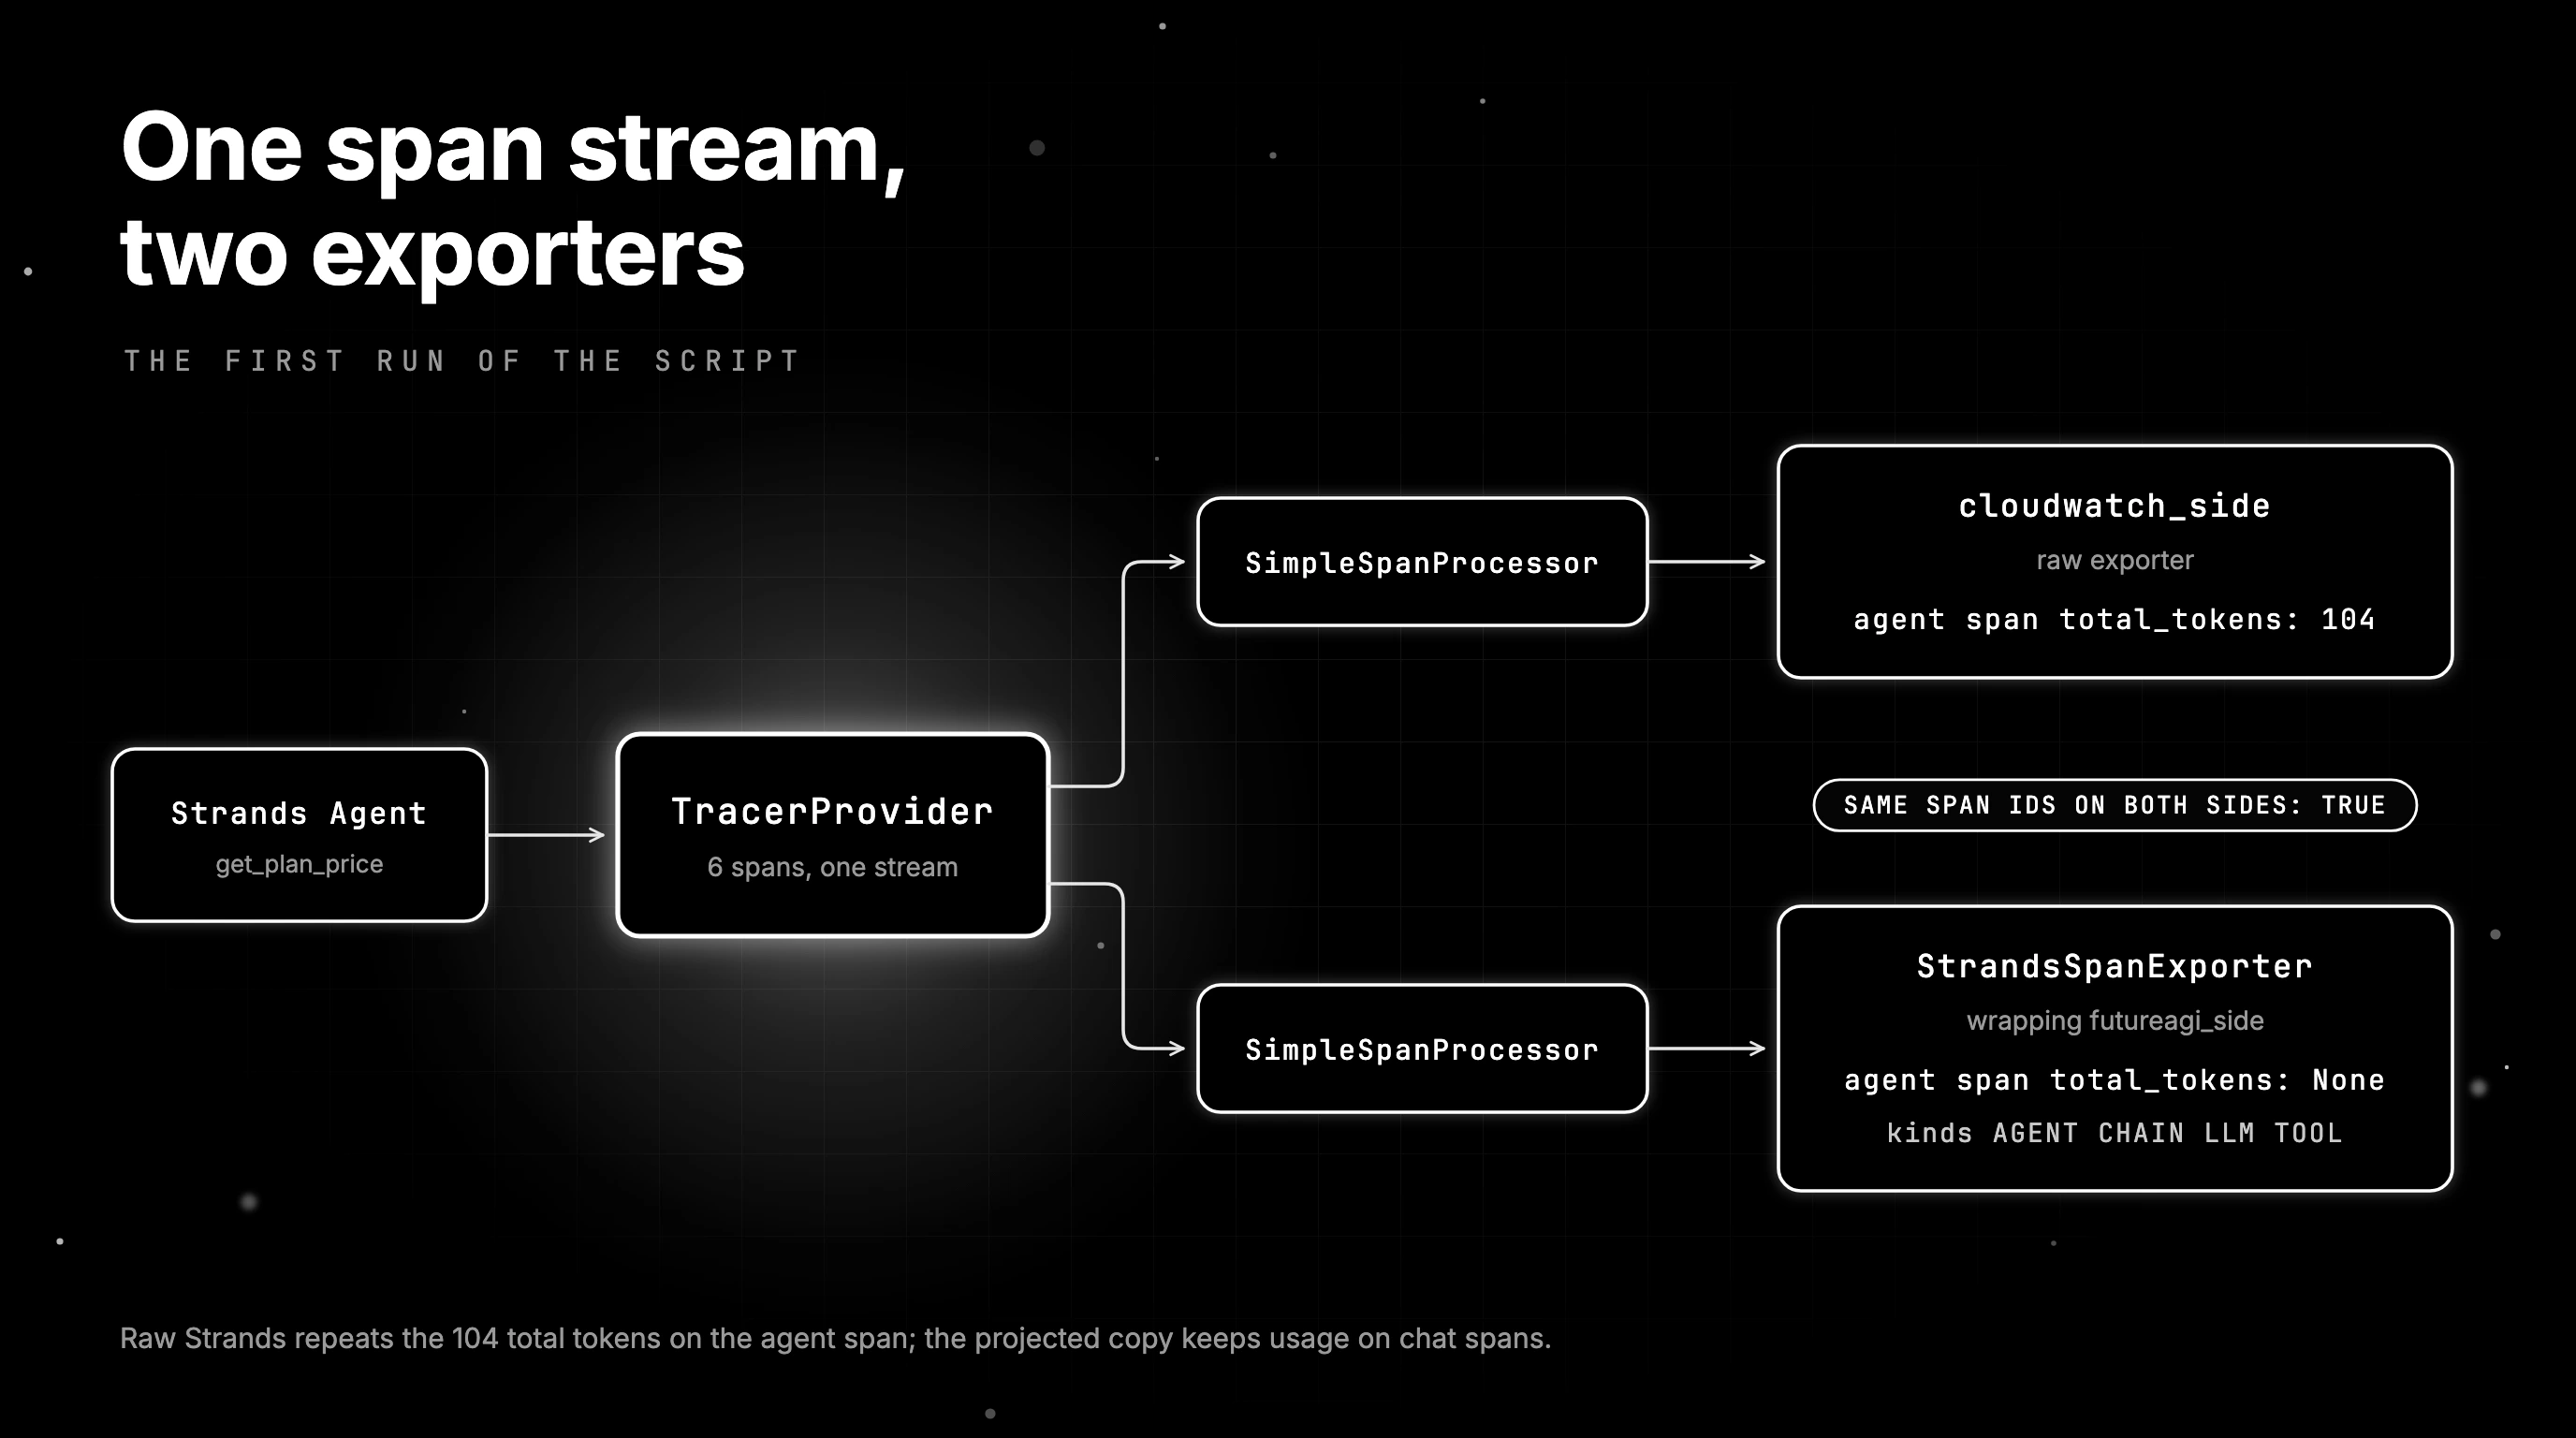
The projected copy drops that aggregate from the agent span and labels spans AGENT, CHAIN, LLM and TOOL. Run 2 is the intro’s miss: every span is OK, the tool output holds “unknown plan”, and the agent span keeps the question and the apology in input.value and output.value. Those two fields are what a task-level eval reads.
Running Evals on the Spans Your Agent Already Emits
An eval on spans needs three things the trace already holds: the user input, the final output and the tool calls between them. If your exporter strips content, the eval has nothing to read, so decide on content capture before you pick a backend, then point the eval at agent spans rather than every span.
Content capture is opt-in. The traceai-strands adapter exports prompts, responses and tool payloads only with capture_content=True, and Strands’ own redaction settings can remove content before any exporter sees it. Check both before you conclude that a backend lost your prompts somewhere along the way.
On the AWS side, AgentCore Evaluations is one route: it became generally available in March 2026 with 13 built-in evaluators, per the AgentCore release notes. A second backend suits evals next to traces from agents that also run outside AgentCore.
The AgentCore pricing page says Evaluations results land in AgentCore Observability and built-in evaluators bill per token.
For action groups, knowledge bases and guardrails, see our guide to evaluating AWS Bedrock agents end to end.
When an exact rule is enough, and cheap enough to run on every span, our post on code-based checks for agent traces covers that option.
Agent Spans Versus Tool Spans as Eval Targets
The agent span carries the user’s prompt and the final answer, which is what a task-level judge needs to decide whether the request was fulfilled. Tool spans carry arguments and results, which suit call-level checks against an expected set, such as “a price question must call get_plan_price with a key that exists”.
Troubleshooting Bedrock AgentCore Observability When Spans Go Missing
Most Bedrock AgentCore observability gaps come from four causes: Transaction Search is off, a second provider lost the race to ADOT, the exporter started after the first spans ended, or the invocation was cancelled. Each leaves a different signature in the startup logs, so read those before changing exporter settings.
No spans usually means Transaction Search is off. Spans missing from the agent log group point to a role without logs:PutResourcePolicy, or ADOT older than 0.18.0, which sends them to aws/spans instead. The override warning means the wrapper is still on: check enableOtel and, for containers, the Dockerfile CMD.
A missing first invocation means tracing started after the Agent was built, so register at module import. Cancelled or timed-out invocations can drop spans, and an early-closed stream can leave a cycle span unended, so consume the async iterator to completion.
The early-close case is tracked in Strands issue #5331.
The cancel and timeout case is tracked in the Strands issue on spans dropped when an invocation is cancelled.
One cause of a 404 from an OTLP backend is /v1/traces appended twice. A per-signal variable such as OTEL_EXPORTER_OTLP_TRACES_ENDPOINT is used exactly as given, while the generic OTEL_EXPORTER_OTLP_ENDPOINT gets /v1/traces added, so put the full path only in the per-signal form.
The URL rule comes from the OpenTelemetry OTLP exporter specification.
Reading the Startup Log Before the Trace
Standard output lands in [runtime-logs] <UUID> streams of the agent’s log group, and OTel structured logs in its runtime-logs stream. Search stdout for the “Overriding of current TracerProvider” warning first, then for exporter connection or authentication errors, before you open any trace.
Tracing and Evaluating Strands Agents on AgentCore With Future AGI
Future AGI takes the Strands span tree from AgentCore through the traceai-strands package and an eval task that scores those spans. You register one tracer provider with a StrandsSpanExporter, deploy with the ADOT wrapper off, and Observe shows agent, cycle, model and tool spans with token usage on the model spans.
Install with pip install -U traceai-strands 'strands-agents[otel]>=1.24.0' 'fi-instrumentation-otel>=1.2.2' bedrock-agentcore, where the last package supplies the runtime app. Set FI_API_KEY and FI_SECRET_KEY from a secret store. HTTPSpanExporter() sends both as headers to https://api.futureagi.com/tracer/v1/traces by default, and FI_BASE_URL points it at a self-hosted deployment.
The setup follows the traceai-strands README in the traceAI repository on GitHub, under python/frameworks/strands.
For instrumenting agents beyond Strands, see our walkthrough on instrumenting an AI agent with traceAI.
On the runtime, set DISABLE_ADOT_OBSERVABILITY=true and remove the wrapper (enableOtel false, or plain python in a container CMD), so register() is the only tracing owner. Below is the entrypoint module, minus its docstring, with the same get_plan_price tool as the intro. It was tested end to end.
from fi_instrumentation import register
from fi_instrumentation.fi_types import ProjectType
from fi_instrumentation.otel import HTTPSpanExporter
from traceai_strands import StrandsSpanExporter

# Once per process, before any Agent exists.
provider = register(
    project_type=ProjectType.OBSERVE,
    project_name="strands-agentcore",
    set_global_tracer_provider=True,
    span_exporter=StrandsSpanExporter(HTTPSpanExporter(), capture_content=True),
)

from bedrock_agentcore.runtime import BedrockAgentCoreApp
from strands import Agent, tool
from strands.models import BedrockModel

app = BedrockAgentCoreApp()


PRICE_TABLE = {"Starter": "$12 per seat per month", "Team": "$24 per seat per month"}


@tool
def get_plan_price(plan: str) -> str:
    """Return the list price for a plan from the price table."""
    return PRICE_TABLE.get(plan, "unknown plan")


model = BedrockModel(model_id="global.anthropic.claude-sonnet-4-6")


@app.entrypoint
def invoke(payload, context):
    agent = Agent(model=model, tools=[get_plan_price], callback_handler=None,
                  trace_attributes={"session.id": context.session_id or "no-session"})
    try:
        return {"result": str(agent(payload.get("prompt", "")))}
    finally:
        # Per-invocation 5 s flush: spans leave before the session's microVM idles out.
        provider.force_flush(timeout_millis=5000)


if __name__ == "__main__":
    app.run()
Registering traceai-strands Before the Agent Exists
Registration runs once at module import, before Strands builds its tracer. The README advises flushing at shutdown for long-running services; this entrypoint flushes after each invocation, with a five-second timeout, because AgentCore runs each session in its own microVM and terminates it after an idle timeout, 15 minutes by default.
Tested end to end, each invocation’s spans reached /tracer/v1/traces by the time the call returned, with session.id on every span and both x-api-key and x-secret-key headers sent. Kinds arrived as AGENT, CHAIN, LLM and TOOL, with total tokens only on chat spans. Content capture stays under TraceConfig and the FI_HIDE_* settings.
A Continuous Eval Task on Agent Spans
In Observe, create an eval task filtered to observation_type agent and your project, with the Continuous run type so each run scores new spans as they arrive. A sampling_rate from 1 to 100 sets the share of new agent spans each run scores, and spans_limit applies only to Historical runs. Start below 100 on production traffic.
Attach Task Completion, an LLM-as-Judge eval that reads an input and an output and returns Pass or Fail with a reason. Map input to the agent span’s input.value and output to output.value. Results appear on each span in Observe and can drive alerts when the failure rate climbs.
Getting the Wrong-Answer Ticket Answered From One Trace
Redeploy the agent with traceai-strands and a continuous Task Completion task, then ask it the same team plan question. The next miss arrives in Observe with a Pass or Fail result and a reason on its agent span, because the input asks for a price and the output gives none. Open that trace to see get_plan_price return “unknown plan”.
Deploy with the wrapper off, switch on the task, send “What does the team plan cost per seat?”, and confirm the invoke_agent, chat and execute_tool get_plan_price spans appear. Then read the result. The eval flags the unanswered request, and the tool span shows you where it broke.
The fix is one line: match plan names case-insensitively inside get_plan_price. Ship it, keep the eval task running, and the same question stops producing a polite non-answer. Register traceai-strands before your Agent exists, and the next quiet failure will arrive with a score attached.
Frequently Asked Questions
How does Bedrock AgentCore observability use OpenTelemetry?
What does Amazon Bedrock AgentCore do?
Is Amazon Bedrock AgentCore free?
How do I send Strands agent traces to a backend other than CloudWatch?
What is Amazon Bedrock AgentCore evaluation?
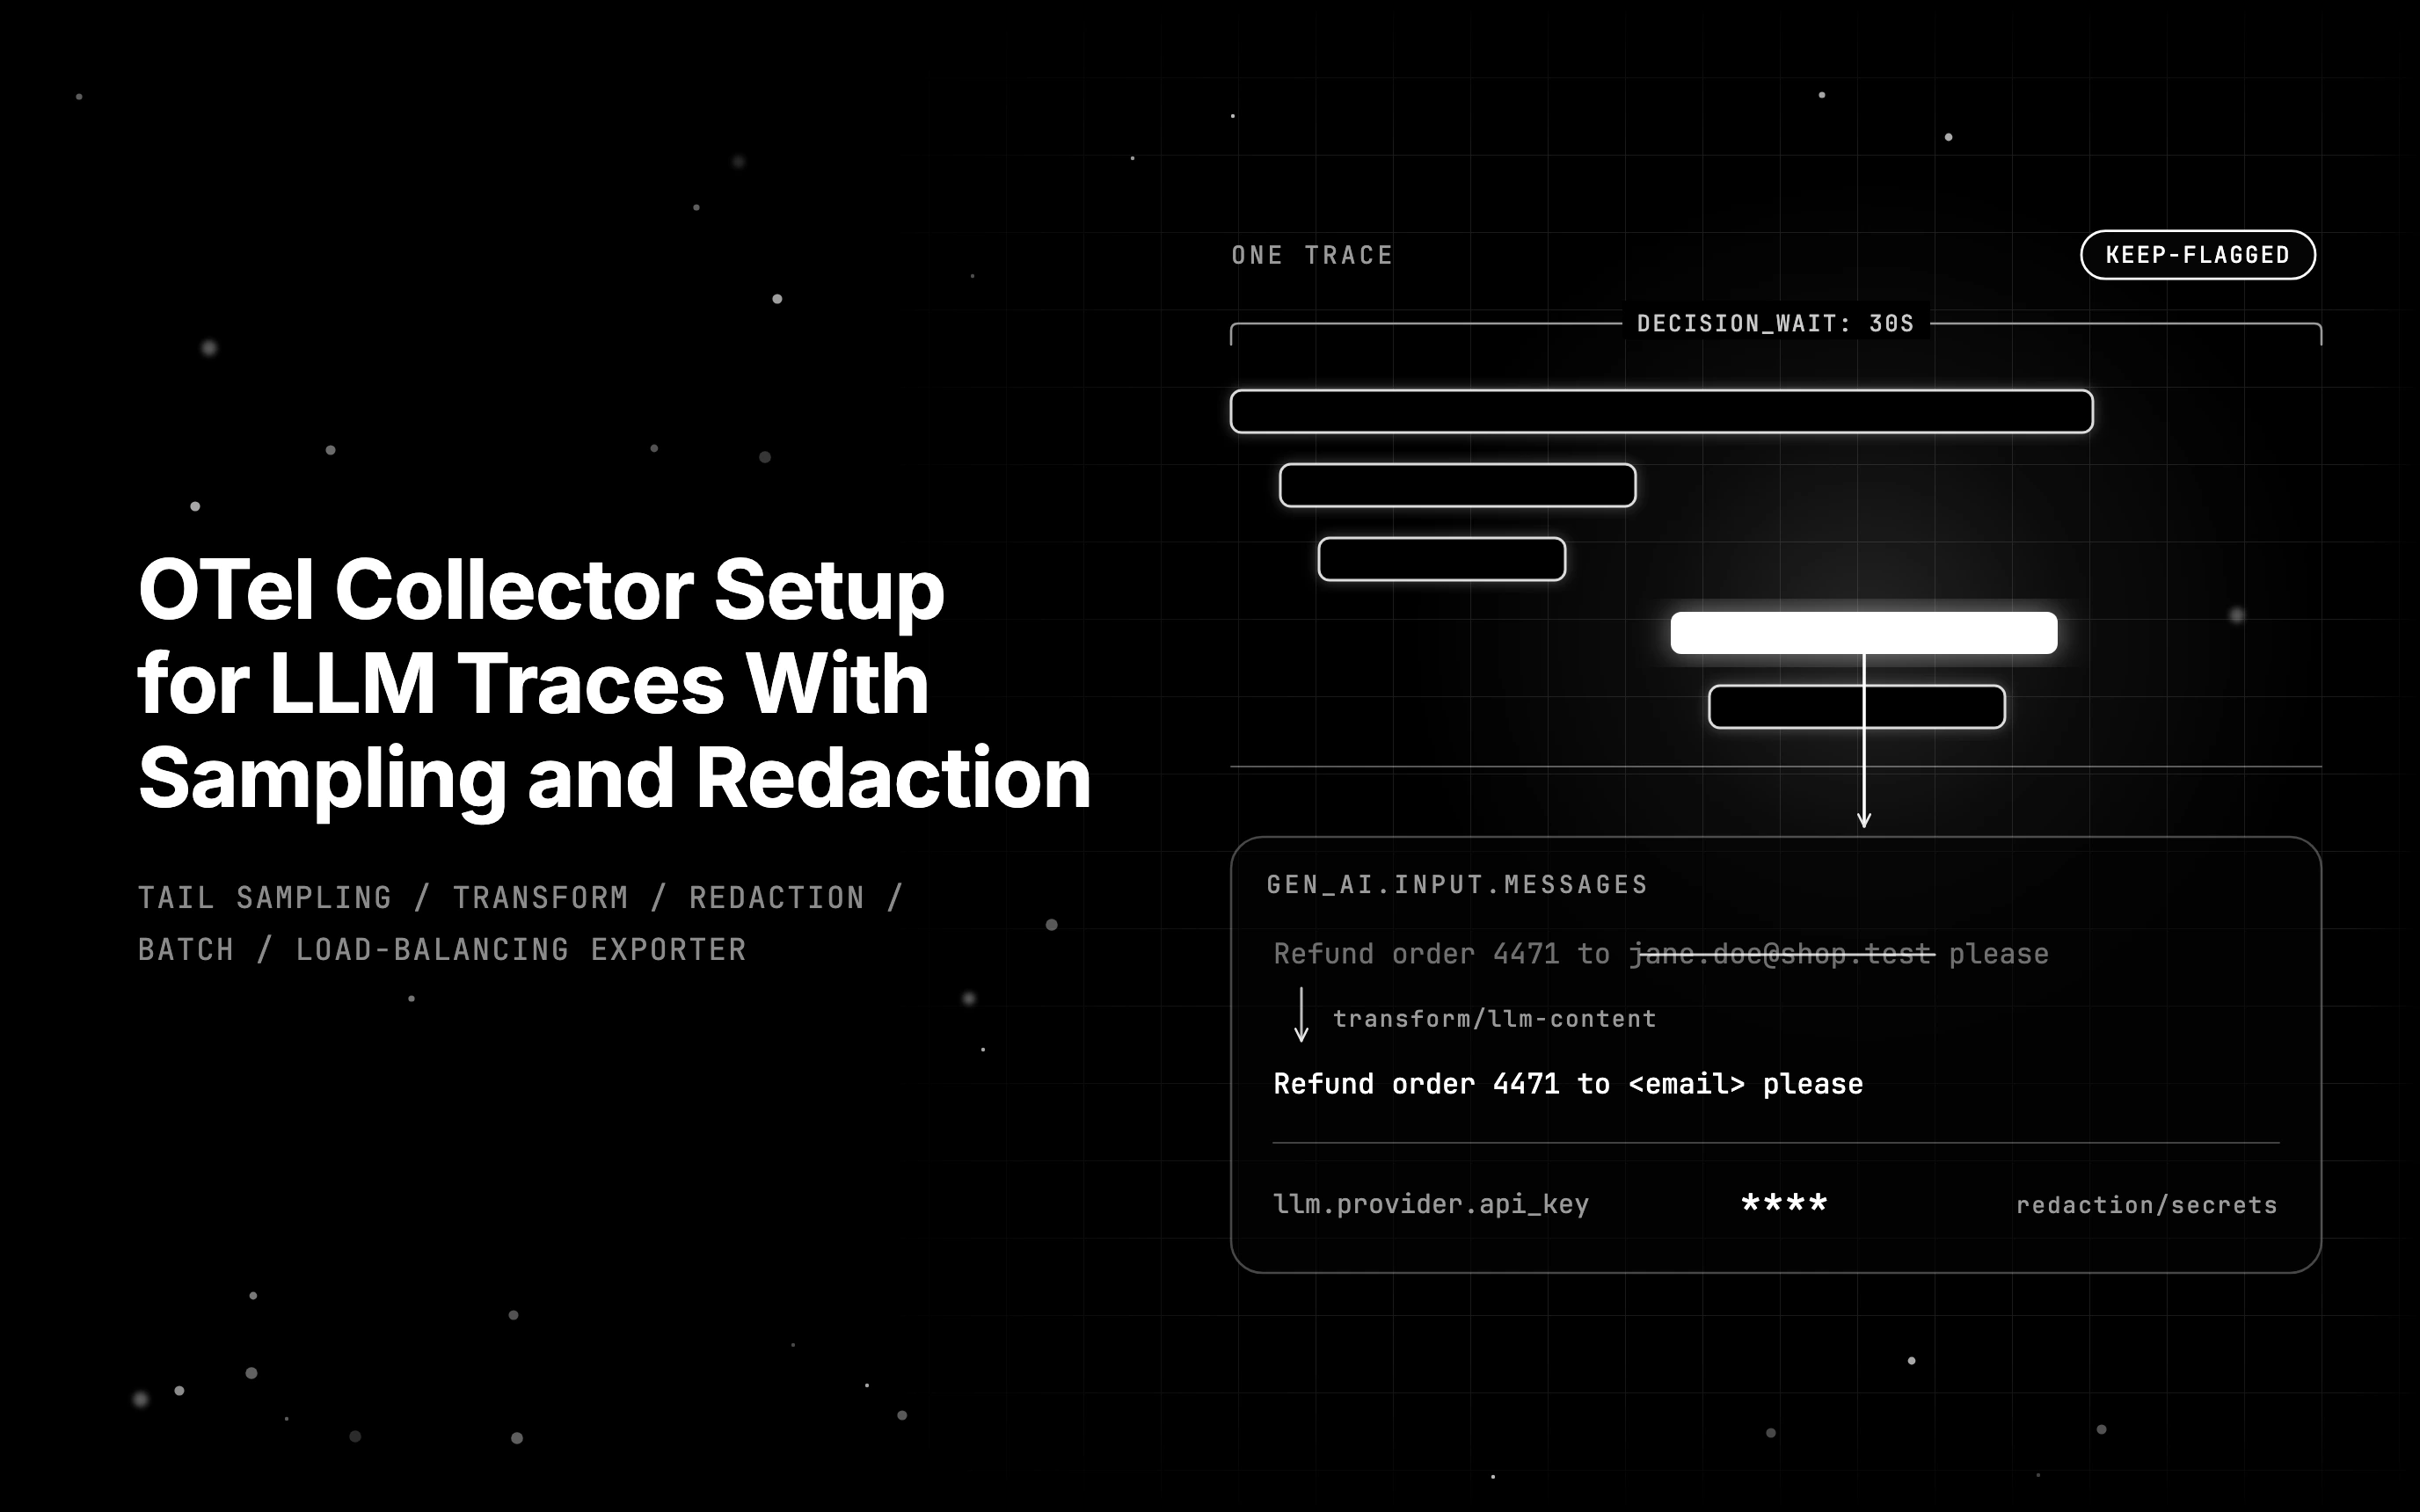
Set up an OTel collector for LLM traces: tail sampling that keeps failed and flagged runs, prompt and output redaction, batching, and two OTLP backends.

Learn the a2a protocol at v1.0: Agent Cards, task states, auth schemes, and a runnable Python handoff between two agents, traced end to end in one trace.
Learn why AI agents fail in production: read the trace, find the broken layer across tools, retrieval, planning, output, or infra, then replay to prove the fix.
