Claude API Logging With OpenTelemetry for Messages and Agent SDK
Claude API logging with OpenTelemetry: fields to keep per Messages call, native export vs SDK spans, Agent SDK tracing, cost from usage and prompt redaction.
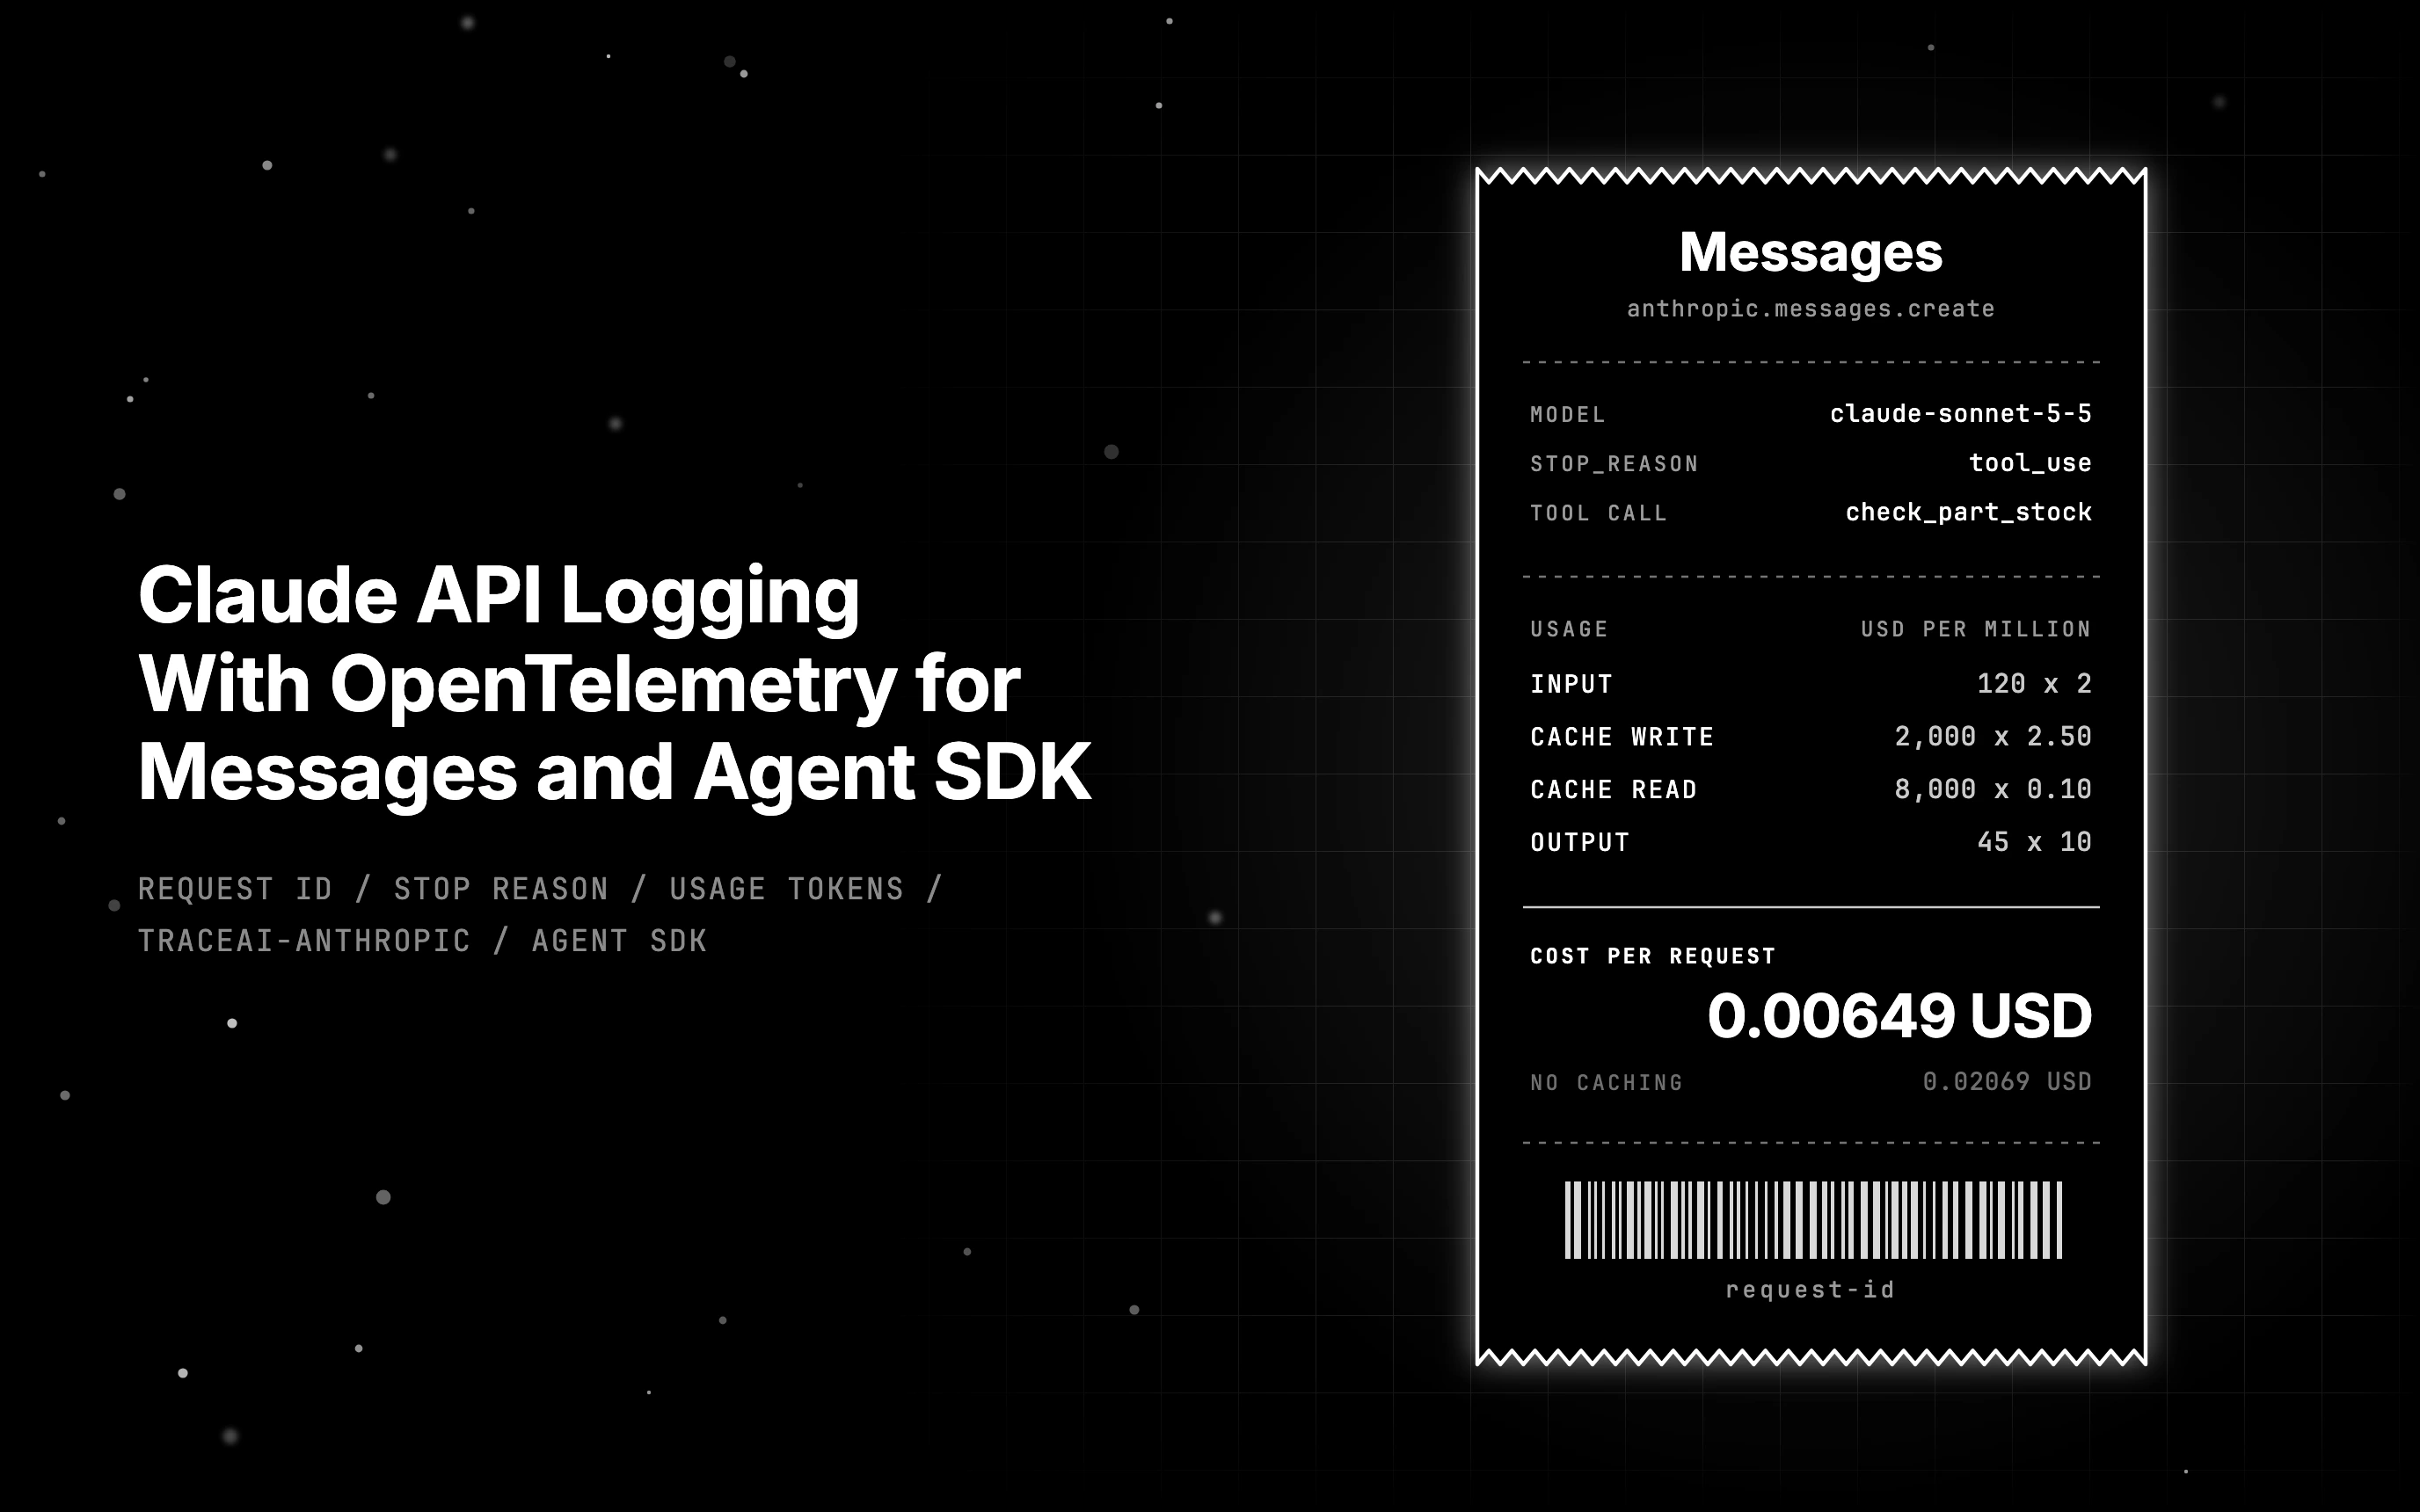
Table of Contents
A team runs a warehouse parts assistant on Claude Sonnet 5.5 with a single tool, check_part_stock. A week after someone edits the system prompt, the monthly Claude bill comes in well above the month before. The on-call engineer opens the request log and finds an HTTP 200 and a duration for every call, and nothing else.
Claude API logging that thin answers nothing. With no tokens, no stop reason, no tool calls and no request id, nobody can say whether the prompt grew, cache reads stopped landing or the model called the tool more. This is the developer-side log of your own API calls, separate from the Compliance API audit logs and Claude Code monitoring.
You get the fields to keep per request, when Anthropic’s own export covers you, and spans for both the Messages API and the Agent SDK. The Messages API code was tested end to end against a synthetic fixture, and its numbers come from that run.
TL;DR
- Claude API logging needs six things per request: request id, model, stop reason, the four usage token counts, latency and tool use blocks.
- Anthropic’s OpenTelemetry export (beta, October 14, 2026) gives spans per request; the Usage and Cost Analytics API (beta, October 29, 2026) gives billed totals.
- Spans from an instrumentor like traceAI-anthropic sit in your own trace next to retrieval and tool calls, with prompt text hidden in process.
- The Claude Agent SDK runs the Claude Code CLI underneath, so you trace ClaudeSDKClient in process and switch on the CLI’s export for model calls.
- Cost per request is each usage field times its own price, because cache writes, cache reads and fresh input bill at different rates.
The per-request record for Claude API logging
Every Claude request record needs the request id, model, stop reason, latency, any tool use blocks and four token counts from usage. Each value except latency sits in a fixed place on the Messages API response, and the request id arrives in the request-id header. You time latency yourself.
The Compliance API and the Console usage page serve admins and audit teams, while request-level spans serve the developers who own the calling code. This post covers the second kind, the record your app writes for every call it makes to the Messages API.
In the parts assistant, one call asks whether part PN-7731 is in stock in Pune, and Claude replies with a check_part_stock tool call. The log_record function below builds the record from that response, and Table 1 maps each field to Anthropic’s span attribute. Every id, part number and address in the run is synthetic.
The full schema is in the Messages API response fields reference.
run_messages.py
def log_record(message, latency_ms: float) -> dict:
    """Every field worth keeping per request, and where it lives on the response."""
    u = message.usage
    cache_write = u.cache_creation_input_tokens or 0
    cache_read = u.cache_read_input_tokens or 0
    return {
        "request_id": message._request_id,            # request-id response header
        "response_id": message.id,                    # body: id
        "model": message.model,                       # body: model
        "stop_reason": message.stop_reason,           # body: stop_reason
        "latency_ms": round(latency_ms, 1),           # measured around the call
        "usage.input_tokens": u.input_tokens,         # uncached input only
        "usage.cache_creation_input_tokens": cache_write,
        "usage.cache_read_input_tokens": cache_read,
        "usage.output_tokens": u.output_tokens,
        "total_input_tokens": u.input_tokens + cache_write + cache_read,
        "tool_use": [{"id": b.id, "name": b.name, "input": b.input}
                     for b in message.content if b.type == "tool_use"],
}| Field | Where it lives in the response | Attribute on Anthropic’s native span | Why keep it |
|---|---|---|---|
| Request id | request-id header; SDK _request_id | anthropic.request.id | The id Anthropic support asks for |
| Response id | Body id | gen_ai.response.id | Names the message the model returned |
| Model | Body model | gen_ai.response.model | Price lookup |
| Stop reason | Body stop_reason | anthropic.message.stop_reason | Tells a tool turn from a cut-off |
| Input tokens, uncached | usage.input_tokens | Part of gen_ai.usage.input_tokens | Billed at the base input price |
| Cache write tokens | usage.cache_creation_input_tokens, with the 5m and 1h split | gen_ai.usage.cache_write.input_tokens | Billed above the base price |
| Cache read tokens | usage.cache_read_input_tokens | gen_ai.usage.cache_read.input_tokens | Billed below the base price |
| Output tokens | usage.output_tokens | gen_ai.usage.output_tokens | Billed at the output price |
| Tool use blocks | Content blocks with type tool_use | Inside gen_ai.output.messages in content mode | Shows which tool calls the model requested |
| Latency | Measured around the call | Span duration | Spots slow calls |
Where the four token counts sit in the response
The trap is usage.input_tokens. It holds only the uncached part of the prompt, 120 tokens in the fixture. Anthropic defines total input as that plus cache creation and cache read tokens, which is 10,120 for the same call, since 2,000 tokens went into the cache and 8,000 came out.
Anthropic’s native span and traceAI-anthropic both store that 10,120 sum in gen_ai.usage.input_tokens. A dashboard that adds up usage.input_tokens from raw responses undercounts by the whole cached share. Pick one source per panel and name it in the panel title.
Request id, stop reason and tool use blocks
Every response carries a request-id header, which the Python SDK exposes as message._request_id (request-id header docs). That id is what Anthropic support needs when you report a bad call. The body id names the message itself, so keep both.
stop_reason takes one of seven values: end_turn, max_tokens, stop_sequence, tool_use, pause_turn, refusal and model_context_window_exceeded. A tool_use stop plus the tool use blocks, each with an id, name and input, shows which tool calls the model requested and with what arguments. A tool result or execution span is needed to show that the tool actually ran.
Anthropic’s Claude OpenTelemetry export and the Usage and Cost Analytics API
Anthropic now ships two first-party sources, both in beta. OpenTelemetry export, launched October 14, 2026, sends spans for Messages API requests and Managed Agents sessions. The Usage and Cost Analytics API, launched October 29, 2026, reports token usage and cost per organization, grouped by model, workspace or API key.
The export shows what happened inside one request, and the analytics API shows what the organization was billed for those calls afterwards. Both launch dates come from Anthropic’s release notes, and both features still carried the beta label on November 12, 2026.
OpenTelemetry export, in beta since October 14, 2026
Spans come from two places, as the OpenTelemetry export overview lays out. The Claude SDK emits them in Python, TypeScript, C#, Go, Java, PHP and Ruby with no special permission, covering Messages and Sessions calls, token usage and tools run by the tool runner.
The second source is an API destination. An admin has to add an OpenTelemetry destination in the Claude Console: an OTLP endpoint over HTTP with protobuf, on HTTPS port 443. API spans then cover each model run, Managed Agents turns and server tools, for any client.
Content mode defaults to metadata only, so prompts and completions stay out of the spans unless you opt in. Delivery is at least once and best effort, and Anthropic states that exported spans are not a complete record of your API usage. Calls to the OpenAI-compatible endpoint, POST /v1/chat/completions, get no span.
Usage and Cost Analytics API, in beta since October 29, 2026
The Usage and Cost Analytics API takes the header anthropic-beta: analytics-usage-cost-2026-08-24 on /v1/organizations/analytics/usage and /cost. Console organizations use an Admin API key or another Admin API credential. Enterprise organizations use a read:analytics key that the primary owner creates in claude.ai.
Data typically refreshes within 4 hours and can take up to 24. Grouping by API key works for Console organizations only, and the older Usage and Cost API is legacy but supported. You get billed totals by model, workspace or key, never the prompt, the tool calls or a trace, so use it for the dollar totals.
Do you need SDK spans if Anthropic already exports traces?
If you only need Claude calls on their own and an admin can add a destination, Anthropic’s export is enough. You need spans from your own process when a Claude call has to sit in one trace with retrieval, tool code and the user request, or when prompts must be hidden before export.
| Source | What it records | Setup | Pick it when |
|---|---|---|---|
| traceAI-anthropic in your app | Messages spans with model, tool calls and token counts including cache, in your own trace; TraceConfig hide settings | pip install traceAI-anthropic plus one instrument() call | Claude spans must sit beside retrieval and tool spans, with prompts hidden in process |
| Claude SDK native spans | anthropic.messages.create with stop reason, request id and token attributes | On when the client gets open_telemetry={"tracer_provider": provider} or a global provider is set; anthropic 1.14.0 or later | You want Anthropic’s attribute names and no extra package |
| API destination in the Claude Console | Each model run, Managed Agents turns and server tools, from any client | Admin role, OTLP over HTTPS on port 443 | Calls come from many clients or from Managed Agents |
| Usage and Cost Analytics API | Billed usage and cost by model, workspace or API key | Admin API key (Console) or read:analytics key (Enterprise), beta header | You need billing totals and spend per key |
Anthropic SDK observability means the SDK’s built-in spans. The anthropic-sdk-python changelog entry for 1.14.0 says the SDK creates spans whenever your app registers a global tracer provider. When an instrumentor already owns the call, pass open_telemetry=False to the client so each request gets exactly one span.
Anthropic SDK observability without double counted tokens
Run SDK and API spans together and both arrive named anthropic.messages.create, the SDK span as CLIENT and its child API span as SERVER. Anthropic’s rule is to sum tokens from the API spans when both are on, and count each span once by trace id plus span id.
For API spans of a Messages request, Anthropic says to sum either anthropic.messages.create or anthropic.model_request, not both, plus anthropic.compaction spans when a request has compactions. Write that filter once, in the query behind your token panel, so every chart reads the same spans.
Instrumenting the Messages API with traceAI-anthropic
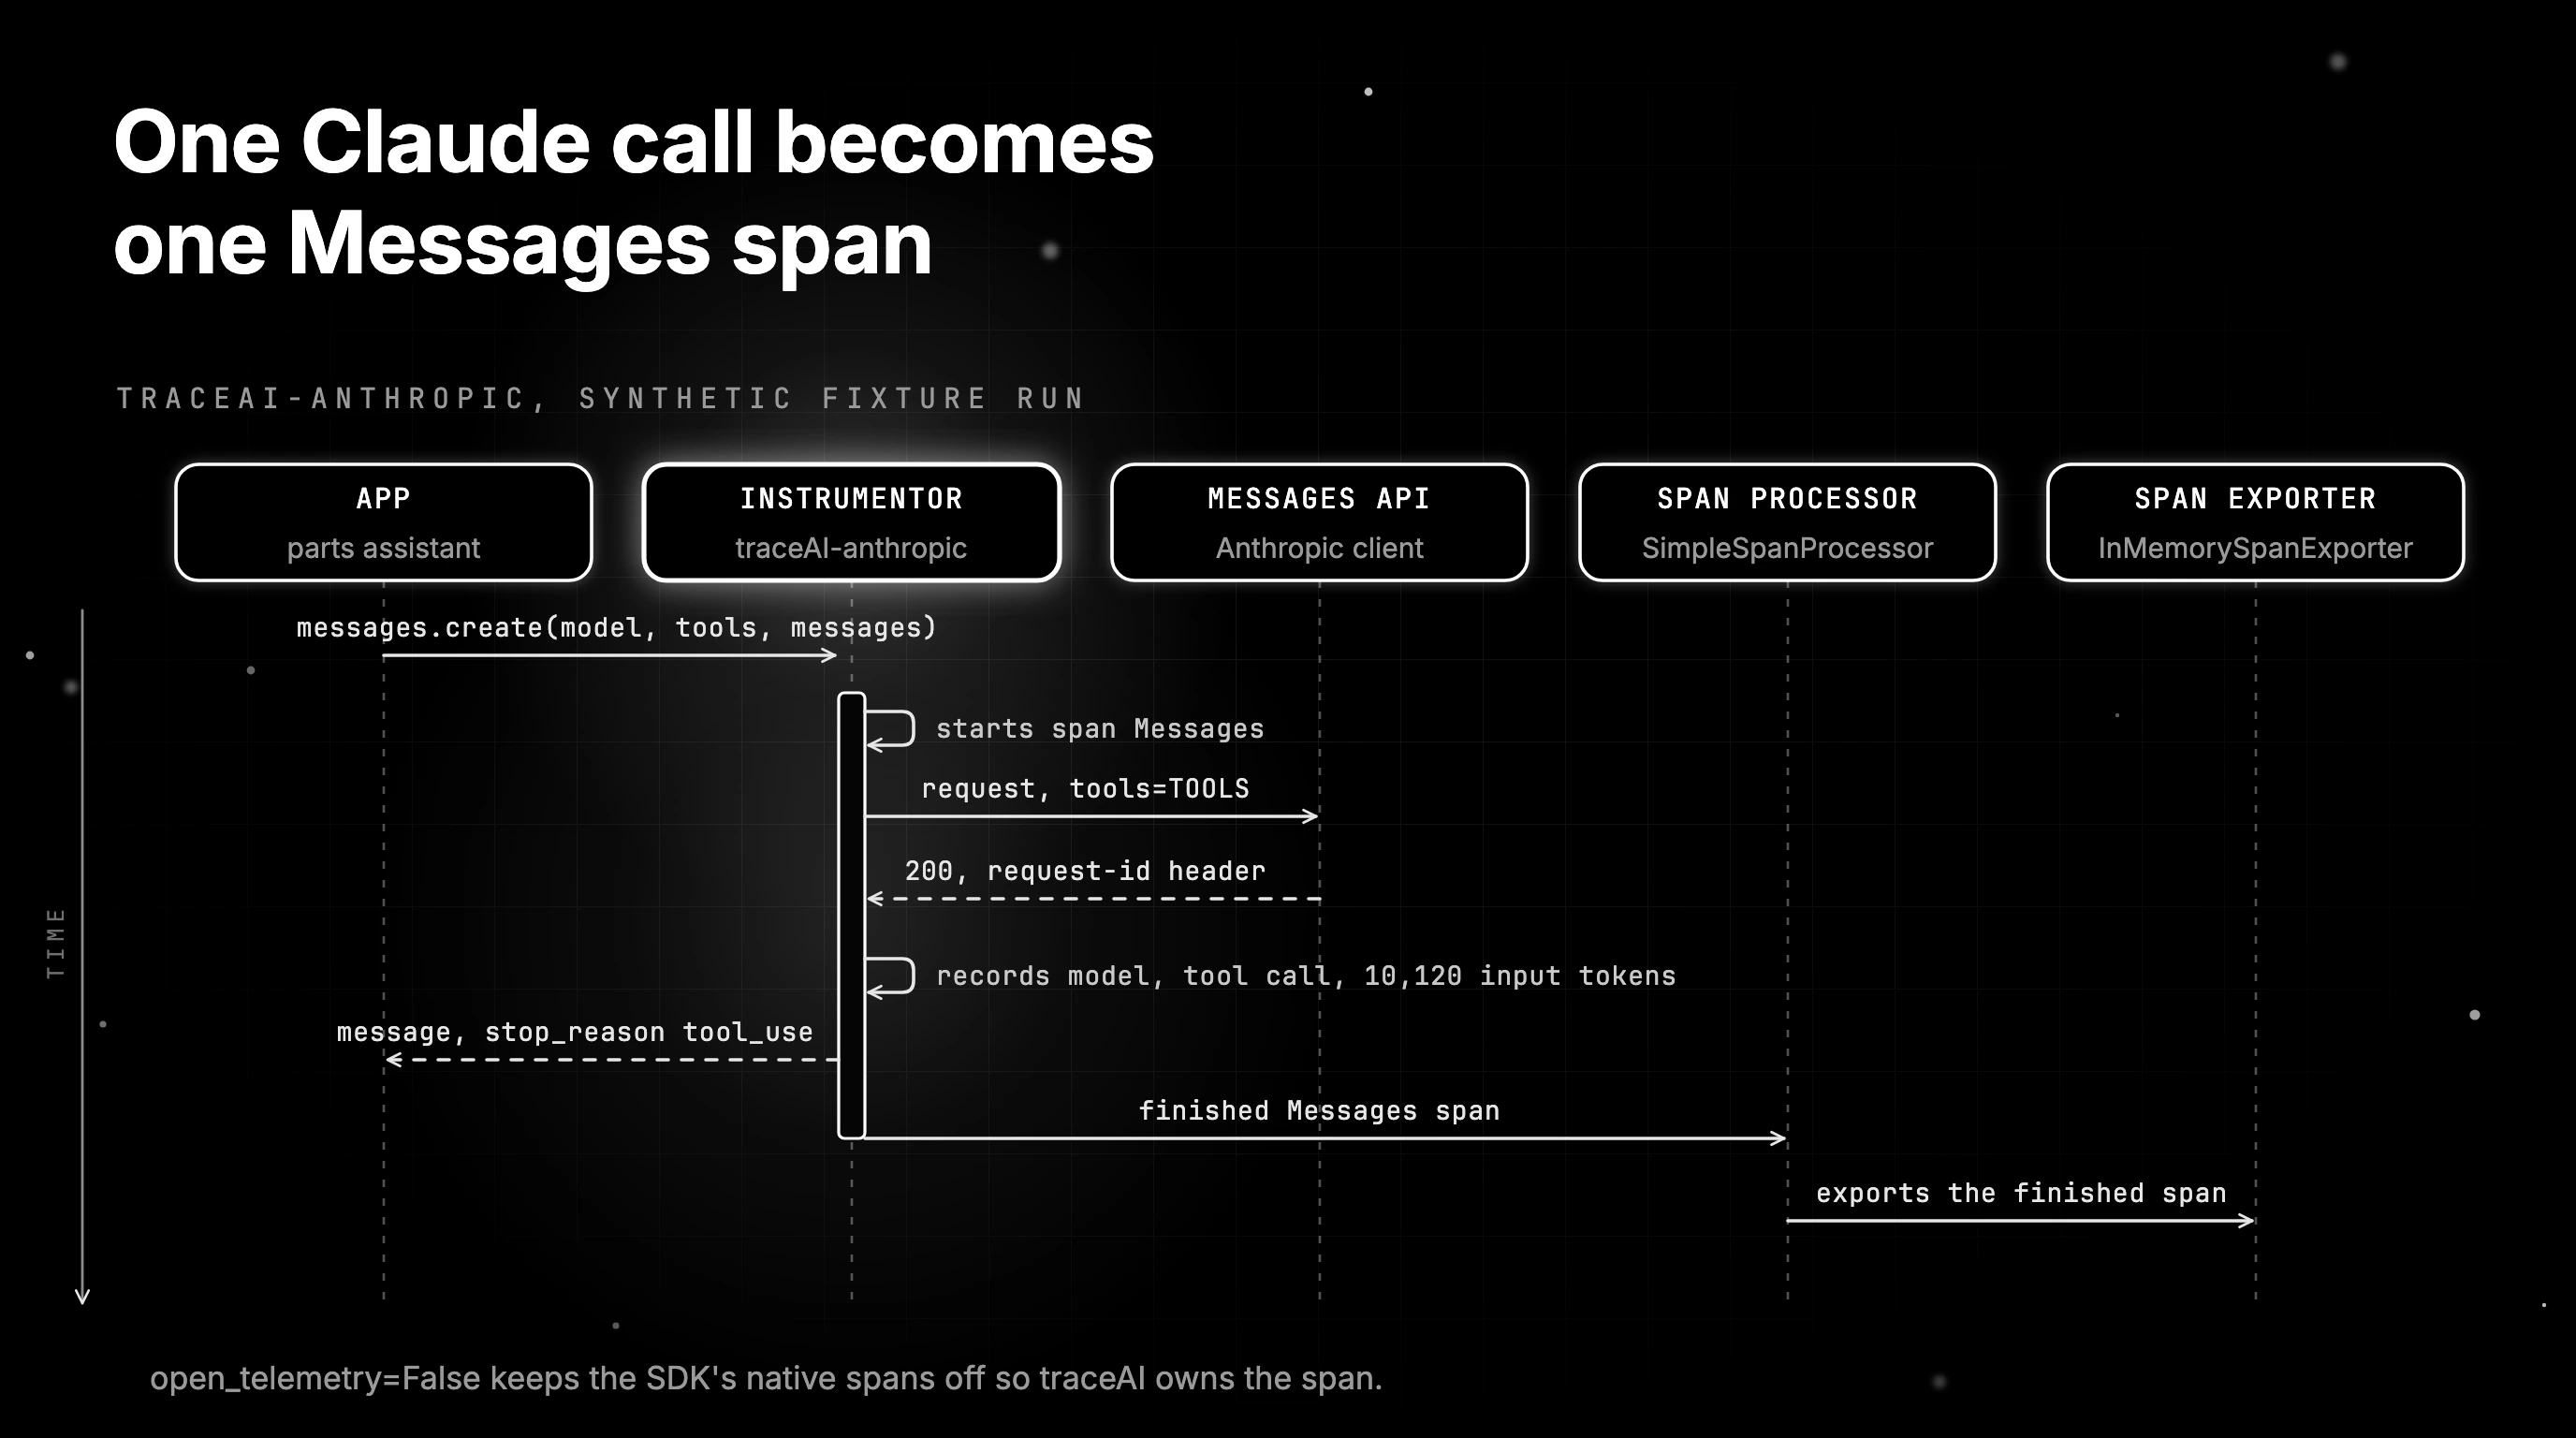
Install traceAI-anthropic, call AnthropicInstrumentor().instrument() with your tracer provider, and every messages.create call becomes a span named Messages. Run against a canned, synthetic response, that span carried the model, the prompt, the tool call and 10,120 input tokens, which includes the 8,000 cache read and 2,000 cache write tokens.
The script pins anthropic 2.8.0, traceAI-anthropic 0.1.14, fi-instrumentation-otel 1.3.2 and opentelemetry-sdk 1.45.2, as of November 12, 2026. An httpx2 MockTransport serves the canned response and an in-memory exporter catches the span, and it was tested end to end with no network access.
Copy every block labeled run_messages.py in this article into one file, in order, including the entry point below cost_usd, then run python run_messages.py. The fixture below is newly supplied and tested against the displayed usage, cost and privacy results; it is not a recovered original fixture. Its token counts are fixed synthetic values, not a tokenization of the short prompt, and it requests a tool without executing it.
pip install anthropic==2.8.0 traceAI-anthropic==0.1.14 fi-instrumentation-otel==1.3.2 opentelemetry-sdk==1.45.2Release history and install notes are on traceAI-anthropic on PyPI.
run_messages.py
import json
import time
from decimal import Decimal

import anthropic
import httpx2 as httpx  # anthropic 2.x builds on httpx2; a plain httpx client raises TypeError
from fi_instrumentation import TraceConfig
from opentelemetry.sdk.trace import TracerProvider
from opentelemetry.sdk.trace.export import SimpleSpanProcessor
from opentelemetry.sdk.trace.export.in_memory_span_exporter import InMemorySpanExporter
from traceai_anthropic import AnthropicInstrumentor

MODEL = "claude-sonnet-5-5"
PROMPT = "Is part PN-7731 in stock in Pune? Reply to fixture@example.invalid."
TOOLS = [{
    "name": "check_part_stock",
    "description": "Check stock for a warehouse part in a city.",
    "input_schema": {
        "type": "object",
        "properties": {"part": {"type": "string"}, "city": {"type": "string"}},
        "required": ["part", "city"],
    },
}]
CANNED = {
    "id": "msg_01FIXTURE", "type": "message", "role": "assistant", "model": MODEL,
    "content": [{
        "type": "tool_use", "id": "toolu_01FIXTURE", "name": "check_part_stock",
        "input": {"part": "PN-7731", "city": "Pune"},
    }],
    "stop_reason": "tool_use", "stop_sequence": None,
    "usage": {
        "input_tokens": 120, "output_tokens": 45,
        "cache_creation_input_tokens": 2000, "cache_read_input_tokens": 8000,
        "cache_creation": {"ephemeral_5m_input_tokens": 2000, "ephemeral_1h_input_tokens": 0},
    },
}
run_messages.py
def handler(request: httpx.Request) -> httpx.Response:
    return httpx.Response(200, json=CANNED, headers={"request-id": "req_01FIXTURE"})


def make_client() -> anthropic.Anthropic:
    # open_telemetry=False keeps the SDK's own spans off, so traceAI is the one span owner
    return anthropic.Anthropic(
        api_key="sk-fixture-not-a-real-key",
        http_client=httpx.Client(transport=httpx.MockTransport(handler)),
        open_telemetry=False,
    )


def call(client: anthropic.Anthropic):
    started = time.perf_counter()
    message = client.messages.create(
        model=MODEL, max_tokens=256, tools=TOOLS,
        messages=[{"role": "user", "content": PROMPT}],
    )
    return message, (time.perf_counter() - started) * 1000
In production, drop http_client and the fixture key so the SDK reads ANTHROPIC_API_KEY from the environment. The MockTransport handler exists only so the run needs no network and no real key. Everything else in the client and the call timing stays as written.
run_messages.py
def run_with(config: TraceConfig):
    exporter = InMemorySpanExporter()
    provider = TracerProvider()
    provider.add_span_processor(SimpleSpanProcessor(exporter))
    instrumentor = AnthropicInstrumentor()
    instrumentor.instrument(tracer_provider=provider, config=config)
    try:
        message, latency_ms = call(make_client())
    finally:
        instrumentor.uninstrument()
    return message, latency_ms, exporter.get_finished_spans()
run_with instruments, calls and uninstruments, so the script can compare default and hidden settings in one process. Your app instruments once at startup. For how traceAI sits on top of the OpenTelemetry SDK, see how traceAI builds on OpenTelemetry.
What the span recorded
With default settings, the Messages span held gen_ai.request.model set to claude-sonnet-5-5, gen_ai.provider.name set to anthropic, the user message and the check_part_stock tool call with its arguments. Its token attributes printed as follows, and gen_ai.usage.input_tokens was 10,120:
  gen_ai.usage.cache_read_tokens = 8000
  gen_ai.usage.cache_write_tokens = 2000
  gen_ai.usage.input_tokens = 10120
  gen_ai.usage.output_tokens = 45
  gen_ai.usage.total_tokens = 10165
Two of those names belong to traceAI-anthropic: gen_ai.usage.cache_write_tokens and gen_ai.usage.cache_read_tokens. Anthropic’s native span calls the read count gen_ai.usage.cache_read.input_tokens, and traceAI’s OpenAI instrumentor writes gen_ai.usage.input_tokens.cache_read. Query the name your instrumentor printed, or a cache panel stays empty.
The script then compared the span with the raw response. The span’s input count matched the sum of the three response fields, and the stop reason showed up only inside the output.value JSON, with no span attribute of its own:
gen_ai.usage.input_tokens on span = 10120
usage.input_tokens + cache write + cache read = 10120
span input tokens match the sum: True
stop_reason as its own span attribute: False
stop_reason readable inside output.value JSON: 'tool_use'
Logging stop reason and request id on your parent span
On a non-streaming messages.create call, traceAI-anthropic 0.1.14 keeps stop_reason and the response id inside the output.value JSON. To filter on them, open a parent span around the call and write them onto it with span.set_attribute, together with _request_id from the response.
Take that span’s tracer from the provider register() returned, as in provider.get_tracer("parts-assistant"), because register() does not set the global provider. In the run, the Messages span then shared the parent’s trace id, and its parent span id equaled the parent’s span id. Keep open_telemetry=False on the client throughout. The run printed both tracer sources:
trace.get_tracer: span is_recording=False traceparent in carrier=False
provider.get_tracer: span is_recording=True traceparent in carrier=True
Claude Agent SDK tracing with traceai-claude-agent-sdk
The Agent SDK runs the Claude Code CLI as a child process, so tracing has two halves. traceai-claude-agent-sdk wraps ClaudeSDKClient and records conversation, turn and tool spans. The CLI exports its own model-call spans once you switch on its telemetry and trace exporter variables. A span you open first puts both halves in one trace.
If the SDK itself is new to you, read what the Claude Agent SDK is and how its loop works.
Anthropic’s Agent SDK observability guide documents the CLI half. The in-process half is traceai-claude-agent-sdk 0.1.2, which patches ClaudeSDKClient, not the top-level query() function. The Agent SDK passes trace context to the CLI only when opentelemetry-api is installed, and fi-instrumentation-otel installs it.
Wiring ClaudeSDKClient
agent_sdk_snippet.py
import asyncio
import os

from claude_agent_sdk import ClaudeAgentOptions, ClaudeSDKClient
from fi_instrumentation import register
from fi_instrumentation.fi_types import ProjectType
from traceai_claude_agent_sdk import ClaudeAgentInstrumentor
agent_sdk_snippet.py
def instrument():
    provider = register(project_type=ProjectType.OBSERVE, project_name="parts-assistant")
    # Use ClaudeSDKClient, which the instrumentor wraps.
    ClaudeAgentInstrumentor().instrument(tracer_provider=provider)
    return provider


async def ask(provider, question: str) -> None:
    options = ClaudeAgentOptions(
        model="claude-sonnet-5-5",
        system_prompt="You answer warehouse stock questions.",
        allowed_tools=["Read"],
    )
    # register() does not set the global tracer provider, so take the tracer from it.
    tracer = provider.get_tracer("parts-assistant")
    # Open your own span before the client connects. The SDK copies the span active at
    # connect into the CLI as TRACEPARENT, so claude_code.interaction and traceAI's
    # claude_agent.conversation span both sit under ask_parts_assistant as siblings.
    with tracer.start_as_current_span("ask_parts_assistant") as span:
        async with ClaudeSDKClient(options=options) as client:
            await client.query(question)
            async for message in client.receive_response():
                usage = getattr(message, "usage", None)
                if isinstance(usage, dict):  # ResultMessage.usage is a dict
                    for key in ("input_tokens", "output_tokens",
                                "cache_creation_input_tokens", "cache_read_input_tokens"):
                        if key in usage:
                            span.set_attribute(f"parts.usage.{key}", usage[key])
register() with ProjectType.OBSERVE returns a tracer provider, and instrument(tracer_provider=provider) ties the instrumentor to it. The ask function opens ask_parts_assistant from that provider before async with ClaudeSDKClient(...) connects. A tracer from trace.get_tracer() records nothing, because register() leaves the global provider unset by default.
With a stand-in transport for the CLI, ask_parts_assistant was the root, with claude_agent.conversation under it and claude_agent.assistant_turn under that. The snippet needs the CLI and a key, so its names were checked against the installed packages. Log tokens from the ResultMessage.usage dict onto your span.
The CLI’s own telemetry export
agent_sdk_snippet.py
def cli_native_export_env() -> dict:
    return {
        "CLAUDE_CODE_ENABLE_TELEMETRY": "1",
        "CLAUDE_CODE_ENHANCED_TELEMETRY_BETA": "1",
        "OTEL_TRACES_EXPORTER": "otlp",
        "OTEL_EXPORTER_OTLP_PROTOCOL": "http/protobuf",
        "OTEL_EXPORTER_OTLP_ENDPOINT": os.environ.get("COLLECTOR_URL", "http://localhost:4318"),
    }
Pass the dict as ClaudeAgentOptions(env=...). The first variable turns telemetry on, the enhanced beta flag is required because traces are still in beta, and the three OTEL_ variables pick exporter, protocol and endpoint. Never set console as the exporter, since the CLI’s stdout carries the SDK’s messages.
The CLI emits claude_code.interaction, claude_code.llm_request and claude_code.tool spans. Hook spans need detailed beta tracing and are out of scope here. The SDK copies the span active at connect into the CLI as TRACEPARENT, so claude_code.interaction and claude_agent.conversation sit under ask_parts_assistant as siblings. With the spawn stubbed, the run captured the CLI environment:
trace.get_tracer: CLI env captured (has CLAUDE_AGENT_SDK_VERSION)=True, TRACEPARENT in CLI env=False
provider.get_tracer: CLI env captured (has CLAUDE_AGENT_SDK_VERSION)=True, TRACEPARENT in CLI env=True
  TRACEPARENT trace id equals ask_parts_assistant trace id: True
  TRACEPARENT parent id equals ask_parts_assistant span id: True
Claude API cost tracking from usage fields
Per-request cost is each usage field times its own price, added up. At Claude Sonnet 5.5 list prices of 2 USD per million input tokens, 2.50 for five-minute cache writes, 0.10 for cache reads and 10 for output, a synthetic fixture request costs 0.00649 USD against 0.02069 USD with no caching.
Those prices are from the Claude pricing page as of November 12, 2026, where one-hour cache writes cost 4 USD per million and cache reads on Sonnet 5.5 are 0.05x the base input price. The script keeps them in one dict, shown below.
run_messages.py
# list prices per million tokens for Claude Sonnet 5.5 (pricing page, read 2026-11-12)
PRICE_PER_MTOK = {"input": Decimal("2"), "cache_write_5m": Decimal("2.50"),
                  "cache_write_1h": Decimal("4"), "cache_read": Decimal("0.10"),
                  "output": Decimal("10")}
run_messages.py
def cost_usd(usage) -> Decimal:
    cc = usage.cache_creation
    cache_write = usage.cache_creation_input_tokens or 0
    cache_read = usage.cache_read_input_tokens or 0
    write_5m = cc.ephemeral_5m_input_tokens if cc else cache_write
    write_1h = cc.ephemeral_1h_input_tokens if cc else 0
    total = (usage.input_tokens * PRICE_PER_MTOK["input"]
             + write_5m * PRICE_PER_MTOK["cache_write_5m"]
             + write_1h * PRICE_PER_MTOK["cache_write_1h"]
             + cache_read * PRICE_PER_MTOK["cache_read"]
             + usage.output_tokens * PRICE_PER_MTOK["output"])
    return total / Decimal(1_000_000)
cost_usd reads the five-minute and one-hour split from usage.cache_creation, and bills every cache write at the five-minute rate when that object is missing. Decimal keeps the sum exact, so totals over thousands of calls do not drift the way float sums can.
Both helpers treat missing or null cache counts as zero. Finish run_messages.py with this entry point. It prints local fixture results for both privacy modes; it does not export to a backend. Keep the raw log_record output out of production logs unless separately redacted: TraceConfig hides span attributes, not that dict.
run_messages.py
if __name__ == "__main__":
    for hidden in (False, True):
        message, latency_ms, spans = run_with(
            TraceConfig(hide_inputs=hidden, hide_outputs=hidden)
        )
        assert len(spans) == 1
        span = spans[0]
        attrs = dict(span.attributes)
        record = log_record(message, latency_ms)
        print(f"\nhide_inputs=hide_outputs={hidden}")
        print(f"span name={span.name} kind={span.kind.name} status={span.status.status_code.name}")
        for key, value in sorted(attrs.items()):
            print(f"  {key} = {value}")
        assert attrs["gen_ai.usage.input_tokens"] == record["total_input_tokens"]
        if not hidden:
            print(json.dumps(record, indent=2))  # synthetic data only
            print("gen_ai.usage.input_tokens on span =", attrs["gen_ai.usage.input_tokens"])
            print("usage.input_tokens + cache write + cache read =", record["total_input_tokens"])
            print("span input tokens match the sum:", attrs["gen_ai.usage.input_tokens"] == record["total_input_tokens"])
            print("stop_reason as its own span attribute:", any("stop_reason" in k for k in attrs))
            print("stop_reason readable inside output.value JSON:", repr(json.loads(attrs["output.value"])["stop_reason"]))
        else:
            print("input.value redacted:", attrs.get("input.value") == "__REDACTED__")
            print("output.value redacted:", attrs.get("output.value") == "__REDACTED__")
            print("token attributes still present:", "gen_ai.usage.input_tokens" in attrs)
            leaks = [k for k, v in attrs.items()
                     if any(text in str(v) for text in (PROMPT, "PN-7731", "fixture@example.invalid"))]
            print("attributes still containing the prompt text:", leaks)
            assert not leaks
        expected = Decimal("6490") / Decimal(1_000_000)
        assert cost_usd(message.usage) == expected
        print(f"request cost: {cost_usd(message.usage):.8f}; hand-written sum: {expected:.8f}")
Use this number to debug a request, not to reconcile an invoice. Billing truth lives in the Usage and Cost Analytics API. The Agent SDK’s own total_cost_usd is, per Anthropic’s Agent SDK cost tracking page, a client-side estimate and not billing data.
To carry the same arithmetic across steps and tool calls in an agent, see token usage tracking per step, tool call and run.
The arithmetic for one request
For the fixture, 120 x 2 + 2,000 x 2.50 + 8,000 x 0.10 + 45 x 10 comes to 6,490. Divide by one million and the request costs 0.00649 USD. The script’s Decimal result equaled that hand-written sum exactly, printing 0.00649000 for both.
With no caching, all 10,120 input tokens bill at 2 USD, so 10,120 x 2 + 45 x 10 is 20,690, or 0.02069 USD. That is about three times the cached cost, the jump a request like this one takes when caching is switched off.
Redacting prompts before Claude API logging leaves your app
Hide prompt text in your own process first, because that is the layer you control. traceAI-anthropic’s TraceConfig replaces inputs and outputs with __REDACTED__ while keeping model and token counts, Anthropic exports metadata only unless you opt in, and a collector processor catches anything that slipped past both. The same collector processor also scrubs Agent SDK spans.
Each layer covers a different source. TraceConfig acts on traceAI-anthropic spans, Anthropic’s content modes act on its own SDK and API spans, and the collector sees everything that passes through it, including traceai-claude-agent-sdk spans, which carry the user prompt in claude_agent.prompt.
traceAI hide settings in the process
Turn on TraceConfig(hide_inputs=True, hide_outputs=True), or set FI_HIDE_INPUTS and FI_HIDE_OUTPUTS in the environment. In the run, the hidden span kept model, provider and every token count, while the text fields printed the redaction marker and the message attributes were gone:
span name=Messages kind=INTERNAL status=OK
  gen_ai.prompts = __REDACTED__
  gen_ai.provider.name = anthropic
  gen_ai.request.model = claude-sonnet-5-5
  gen_ai.request.parameters = __REDACTED__
  gen_ai.span.kind = LLM
  gen_ai.tool.definitions = __REDACTED__
  gen_ai.tool.definitions.0.tool.json_schema = __REDACTED__
  gen_ai.usage.cache_read_tokens = 8000
  gen_ai.usage.cache_write_tokens = 2000
  gen_ai.usage.input_tokens = 10120
  gen_ai.usage.output_tokens = 45
  gen_ai.usage.total_tokens = 10165
  input.value = __REDACTED__
  output.value = __REDACTED__
input.value redacted: True
output.value redacted: True
token attributes still present: True
attributes still containing the prompt text: []
No remaining attribute held the part number or the email address. TraceConfig also has finer flags, hide_input_text and hide_output_text, for partial hiding. These settings apply to traceAI-anthropic spans, while the SDK’s native spans follow Anthropic’s own content mode.
Anthropic content modes and Agent SDK opt-ins
Anthropic’s export runs in Metadata only mode by default, and Full content is opt-in. On the SDK you switch it with ANTHROPIC_OPEN_TELEMETRY_TRACES_CONTENT_MODE=content, and each span then holds up to 0.75 MB of content by default, so leave it off unless someone needs prompts in the trace backend.
The Claude Code CLI behind the Agent SDK keeps prompt and tool content out of everything it exports unless you set OTEL_LOG_USER_PROMPTS, OTEL_LOG_TOOL_DETAILS, OTEL_LOG_TOOL_CONTENT or OTEL_LOG_RAW_API_BODIES. Search your deployment config for those four names before you point the exporter at a shared backend.
Collector-side scrubbing
Processor configs for this layer are covered in redaction processors in an OpenTelemetry Collector. One detail helps with Anthropic spans. Anthropic’s span reference defines gen_ai.input.messages and gen_ai.output.messages as JSON strings, so a pattern replace on the string value works.
The collector, or a custom SpanProcessor in your app, is also where traceai-claude-agent-sdk spans get scrubbed. Target claude_agent.prompt and the tool input attributes, and run the processor before any exporter that leaves your network. Point the CLI’s OTLP endpoint at the same collector and one rule set covers its spans too.
Sending Claude spans to Future AGI with traceAI
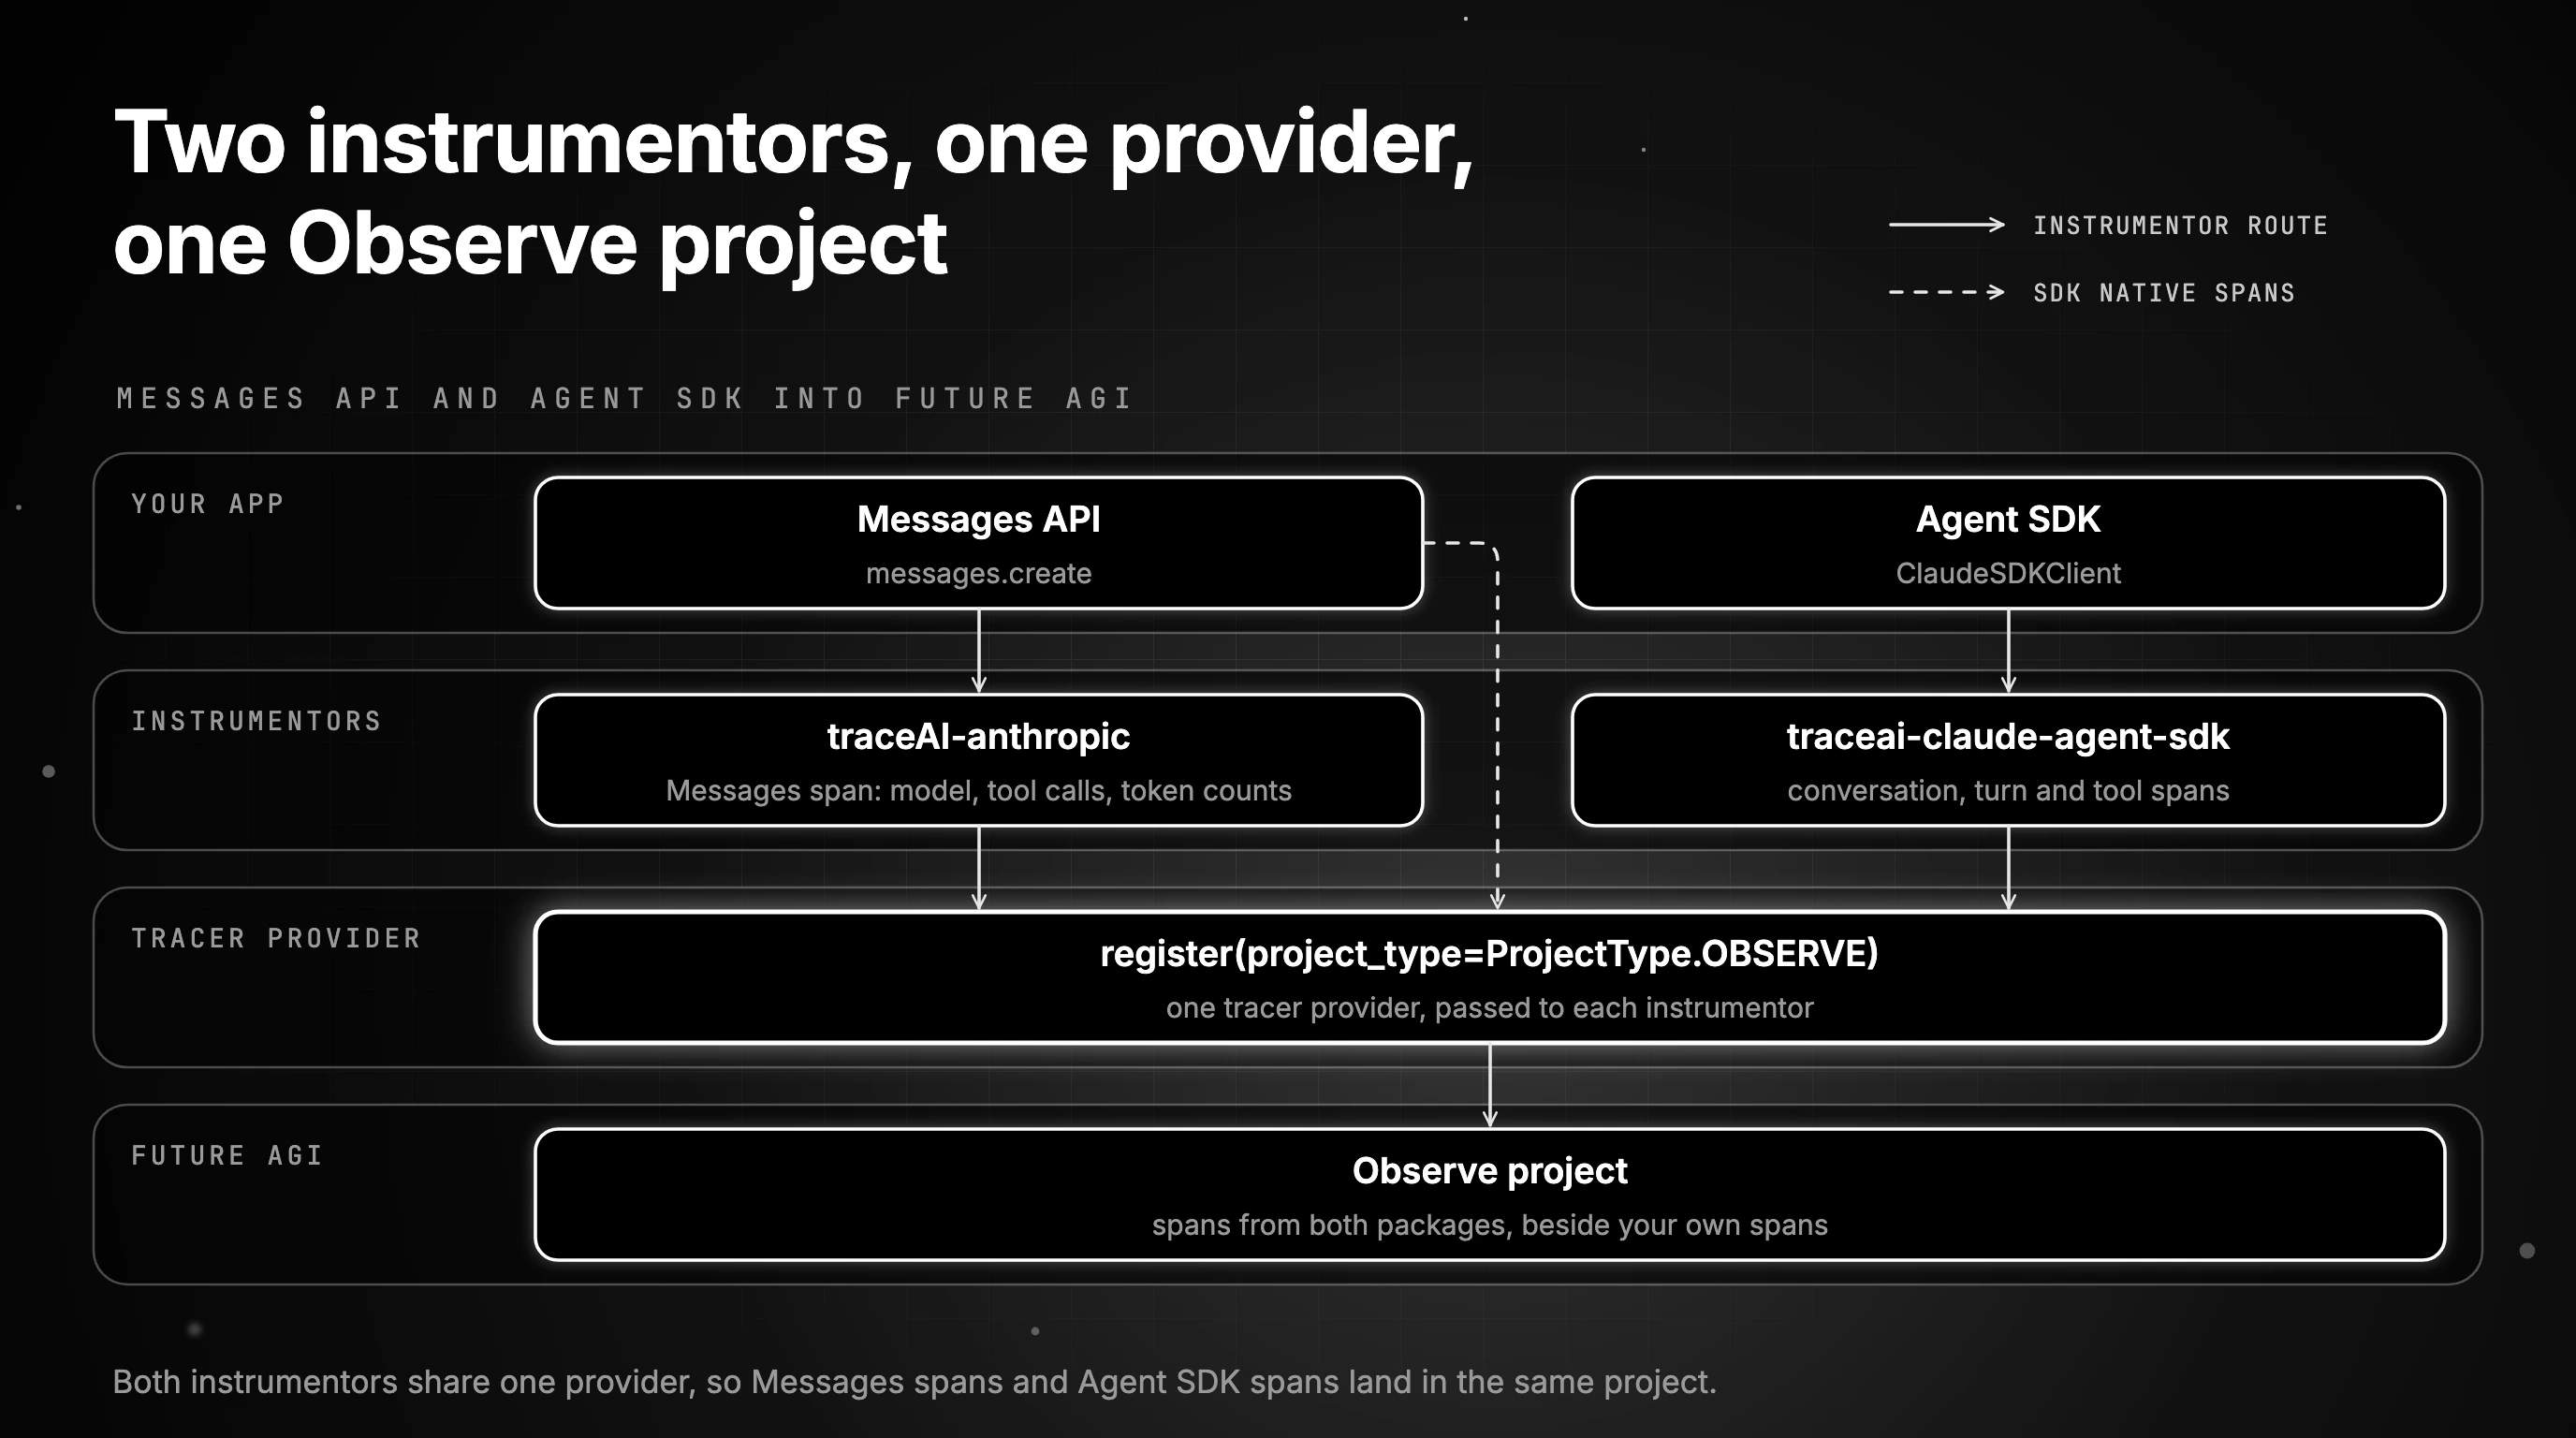
register() gives you a tracer provider that exports to Future AGI. Messages calls reach it through traceAI-anthropic or through the Anthropic SDK’s native spans, and traceai-claude-agent-sdk adds Agent SDK spans. Each traceAI-anthropic span carries the gen_ai.usage.* token counts that traceAI wrote, and Future AGI adds the USD cost (gen_ai.cost.*) server-side as it ingests that span.
Call register() with ProjectType.OBSERVE, then pass the provider to each instrumentor. For native SDK spans, hand the Anthropic client open_telemetry={"tracer_provider": provider}. To keep AnthropicInstrumentor in Python instead, create the client with open_telemetry=False so one owner records each call.
The instrumentor route adds TraceConfig hide settings and carries the session, user and tag context from Future AGI’s context helpers onto each span. Both instrumentors share one provider, so Messages spans and Agent SDK spans land in the same project beside your own spans.
Future AGI’s ingest pricing uses each span’s model and token counts, and any cost already set on a span is kept as it was. The Agent SDK’s own estimate rides on the conversation span as claude_agent.cost.total_usd. Span fields are described in how Future AGI stores spans.
The instrumentors and their source live in traceAI on GitHub.
What reaches Future AGI from each package
From traceAI-anthropic, each call arrives as a Messages span with model, provider, messages, tool calls, token counts and cache splits. From traceai-claude-agent-sdk you get claude_agent.conversation and claude_agent.assistant_turn spans with model, session id and durations, plus one span per tool call named tool.<tool name>.
The package declares five span kinds in claude_agent.span_kind: conversation, assistant_turn, tool_execution, subagent and mcp_tool. A tool span reads tool_execution, or subagent for Task or Agent, and claude_agent.tool.source says builtin, mcp or custom. Spans of every kind land in the same Observe project as the Messages spans.
Tracing the next Claude bill jump to one prompt change
With request id, stop reason, the four token counts and tool calls on every span, the parts assistant’s bill jump comes down to one query. It shows whether cache reads fell after the prompt edit or the model began calling check_part_stock twice, and the Usage and Cost Analytics API confirms the dollars.
Try log_record and cost_usd on one real response first, then point the exporter at your backend. When the next prompt edit ships, pull cache read tokens per call for the week before and the week after and compare them.
Frequently Asked Questions
How do I set up Claude API logging?
Does Claude support OpenTelemetry?
How do I track Claude API cost per request?
How do I trace the Claude Agent SDK with OpenTelemetry?
How do I keep prompts out of exported Claude traces?
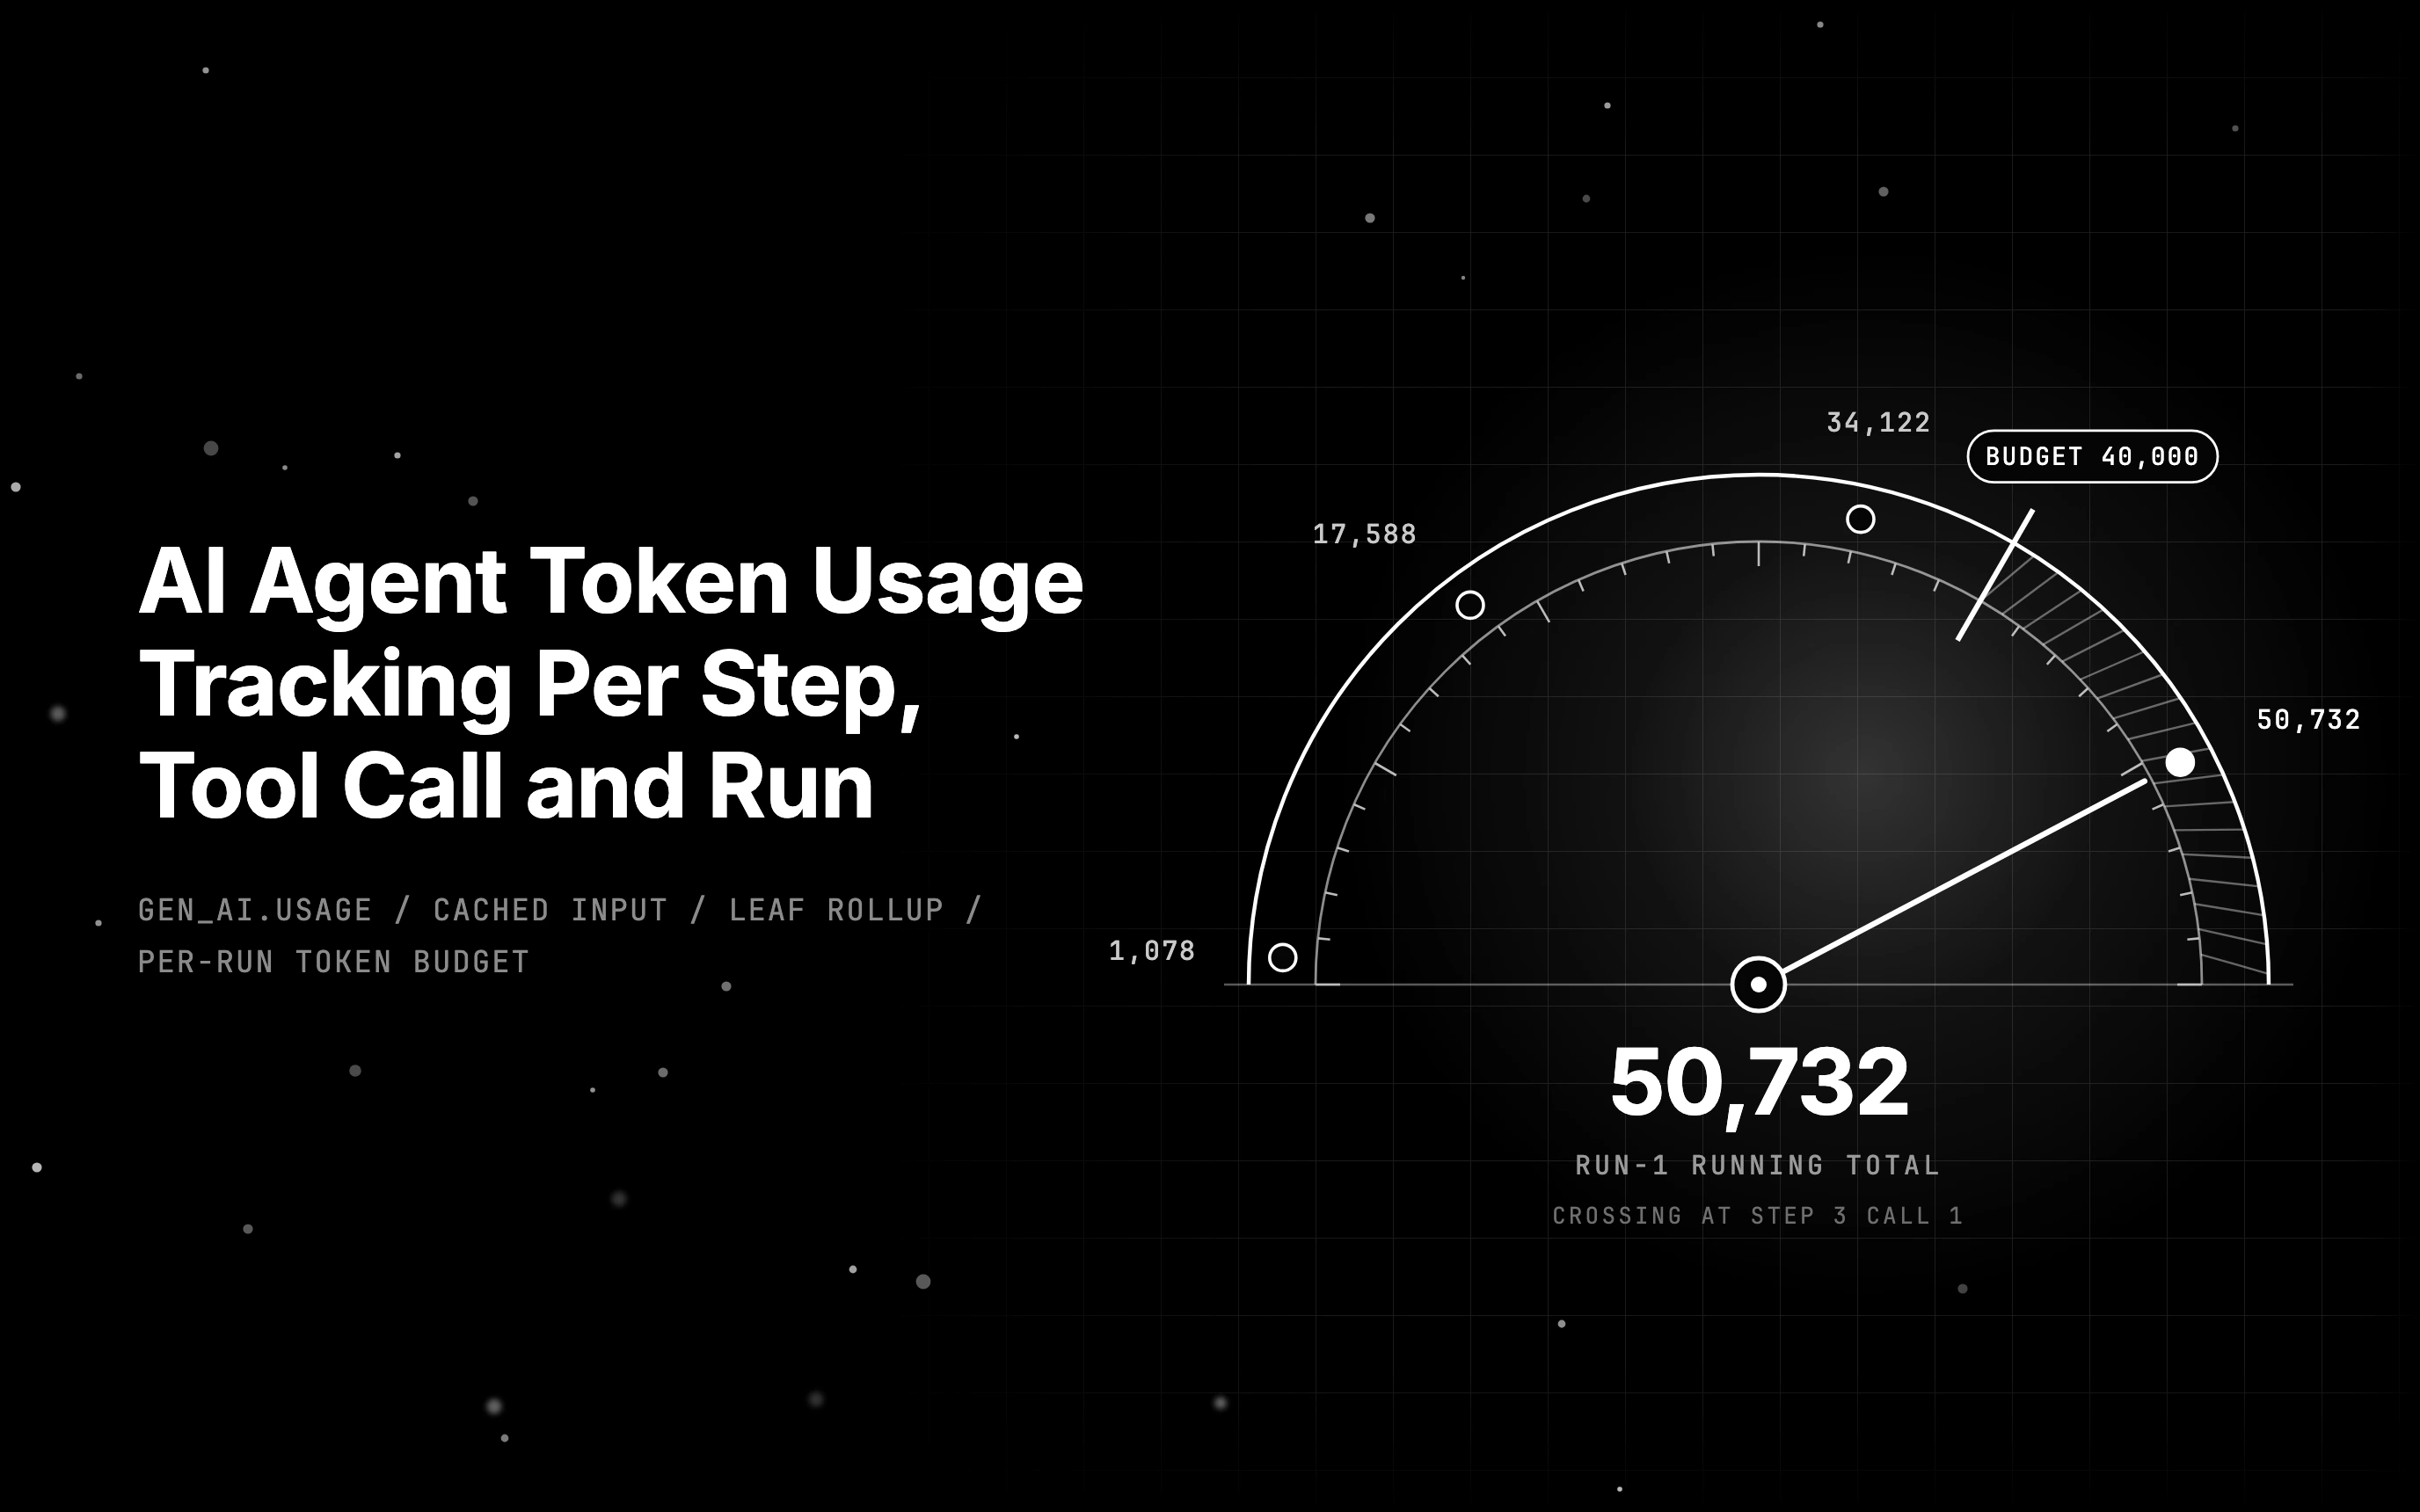
Track AI agent token usage per LLM call, then roll it up by step, tool call and run with OpenTelemetry attributes, a dated price table and per-run budgets.

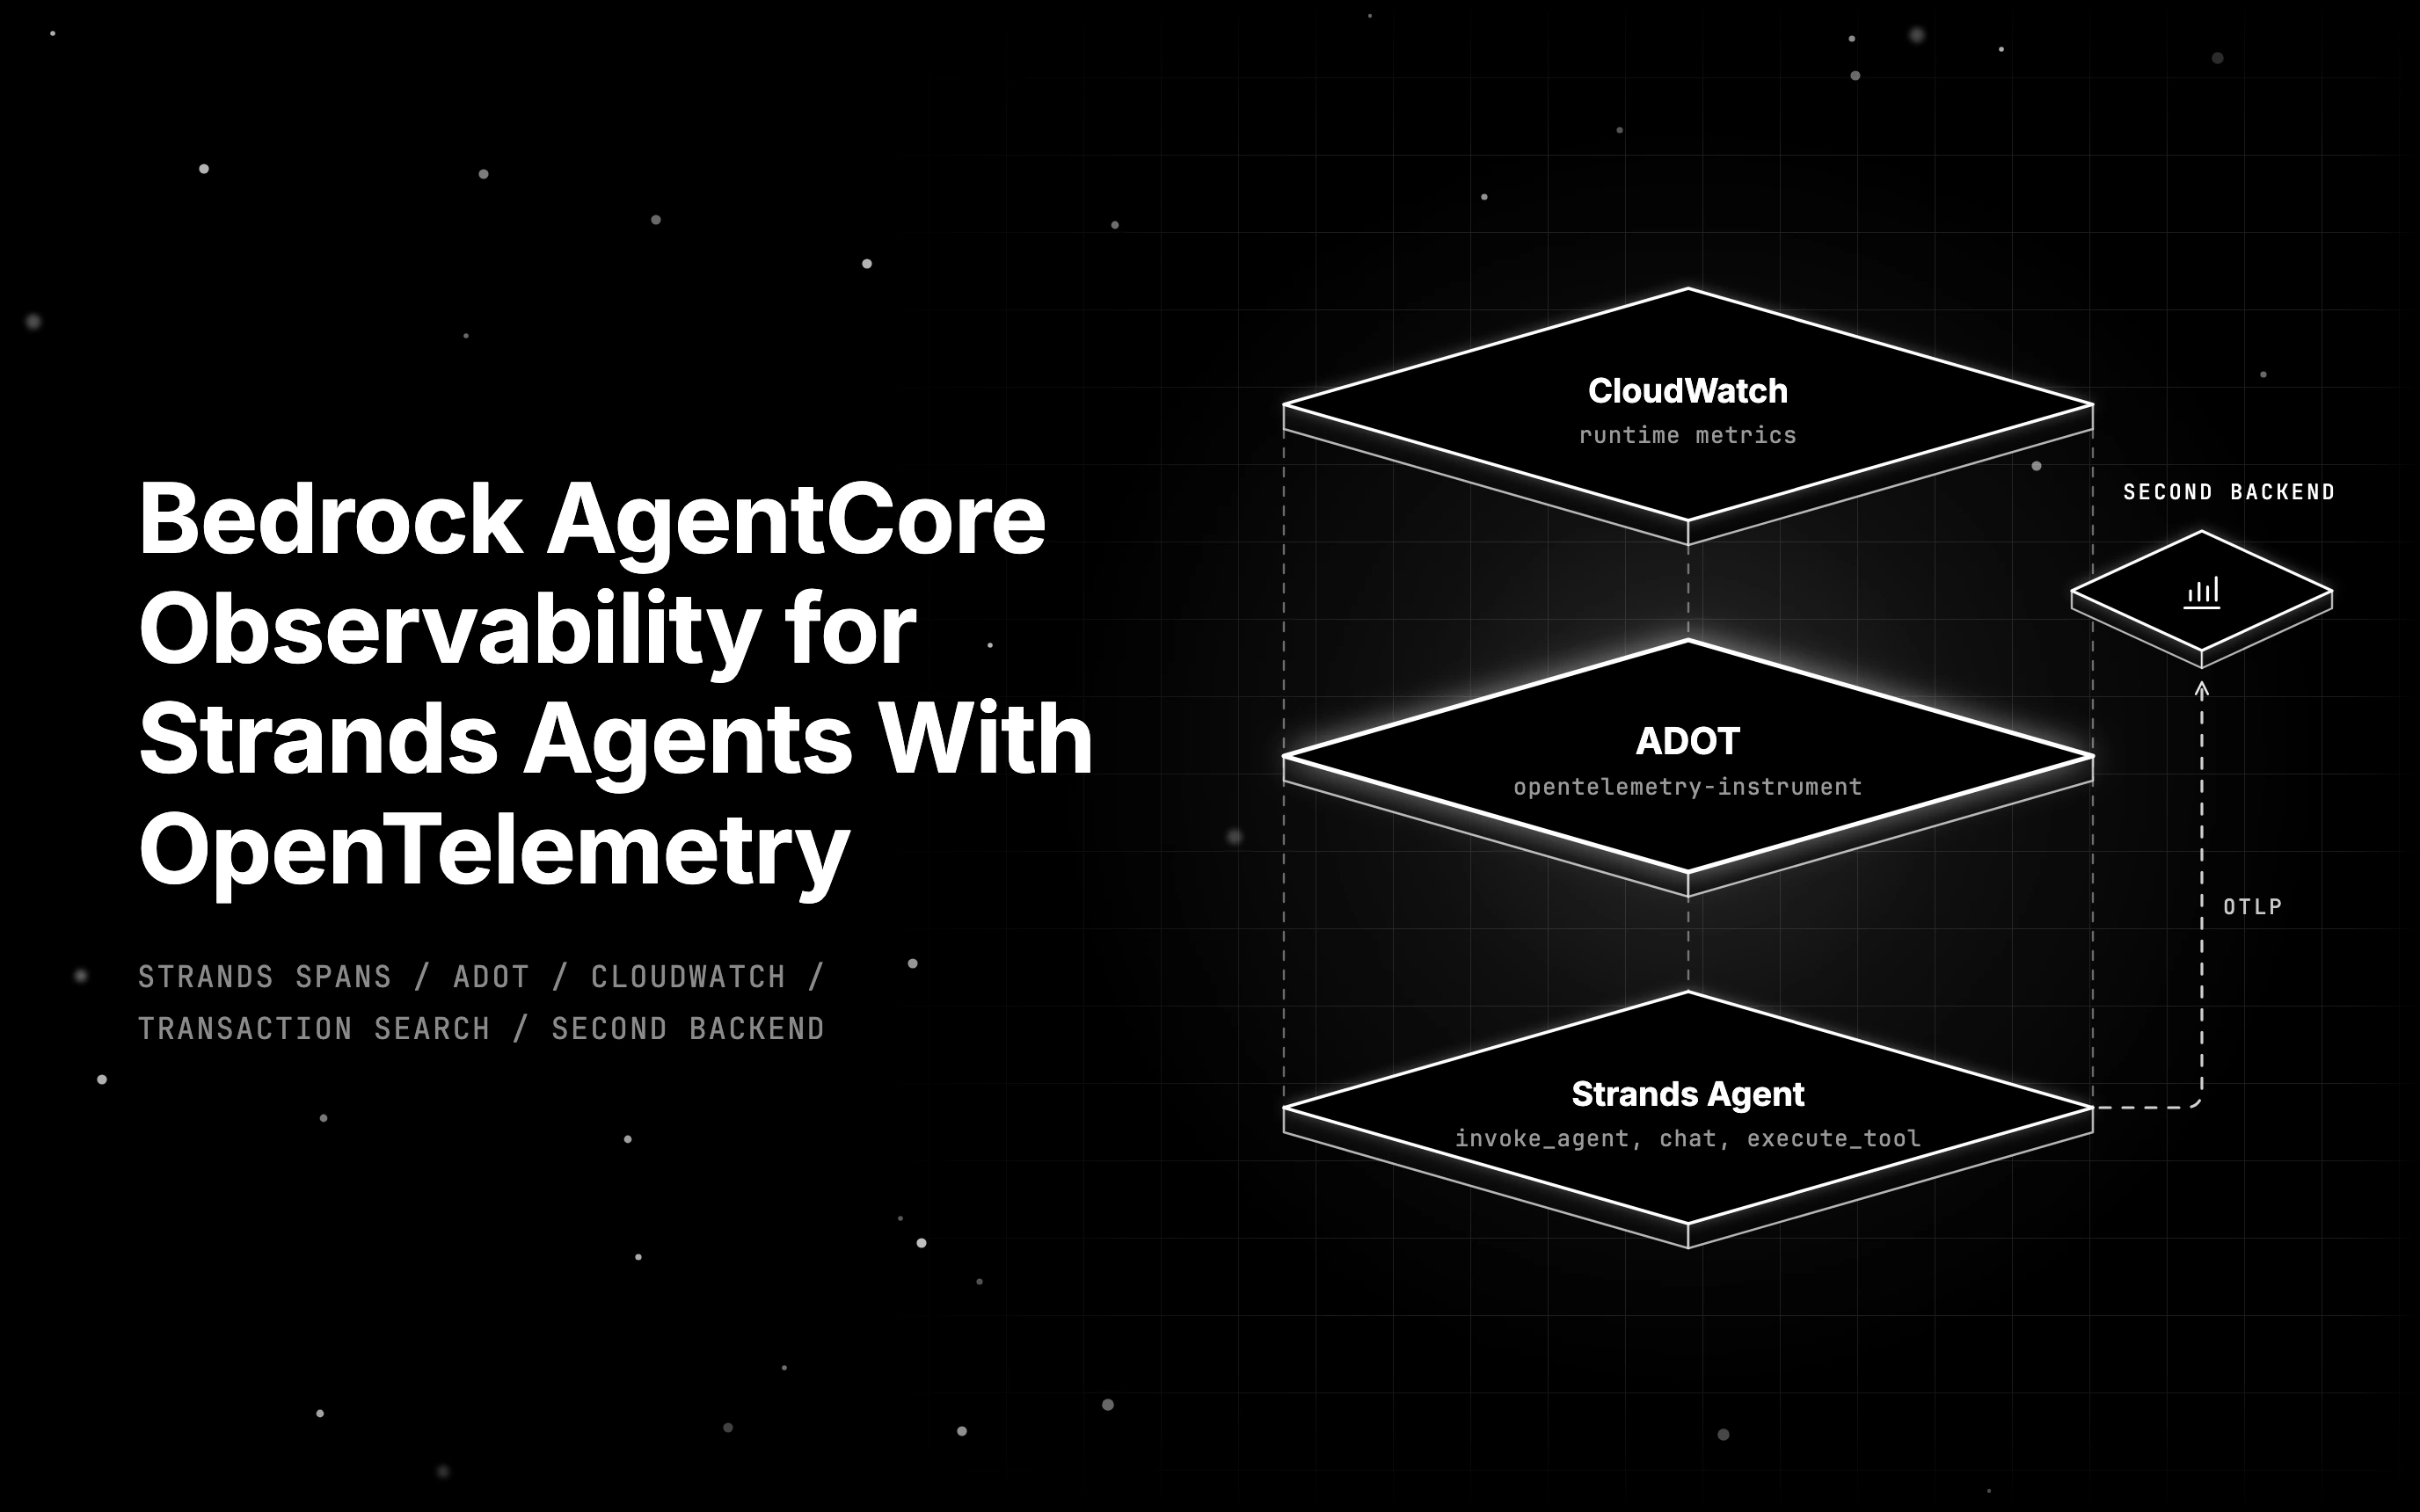
Bedrock AgentCore observability sends Strands spans to CloudWatch by default. See what ADOT captures, what CLI 1.0 changed, and how to run evals on those spans.
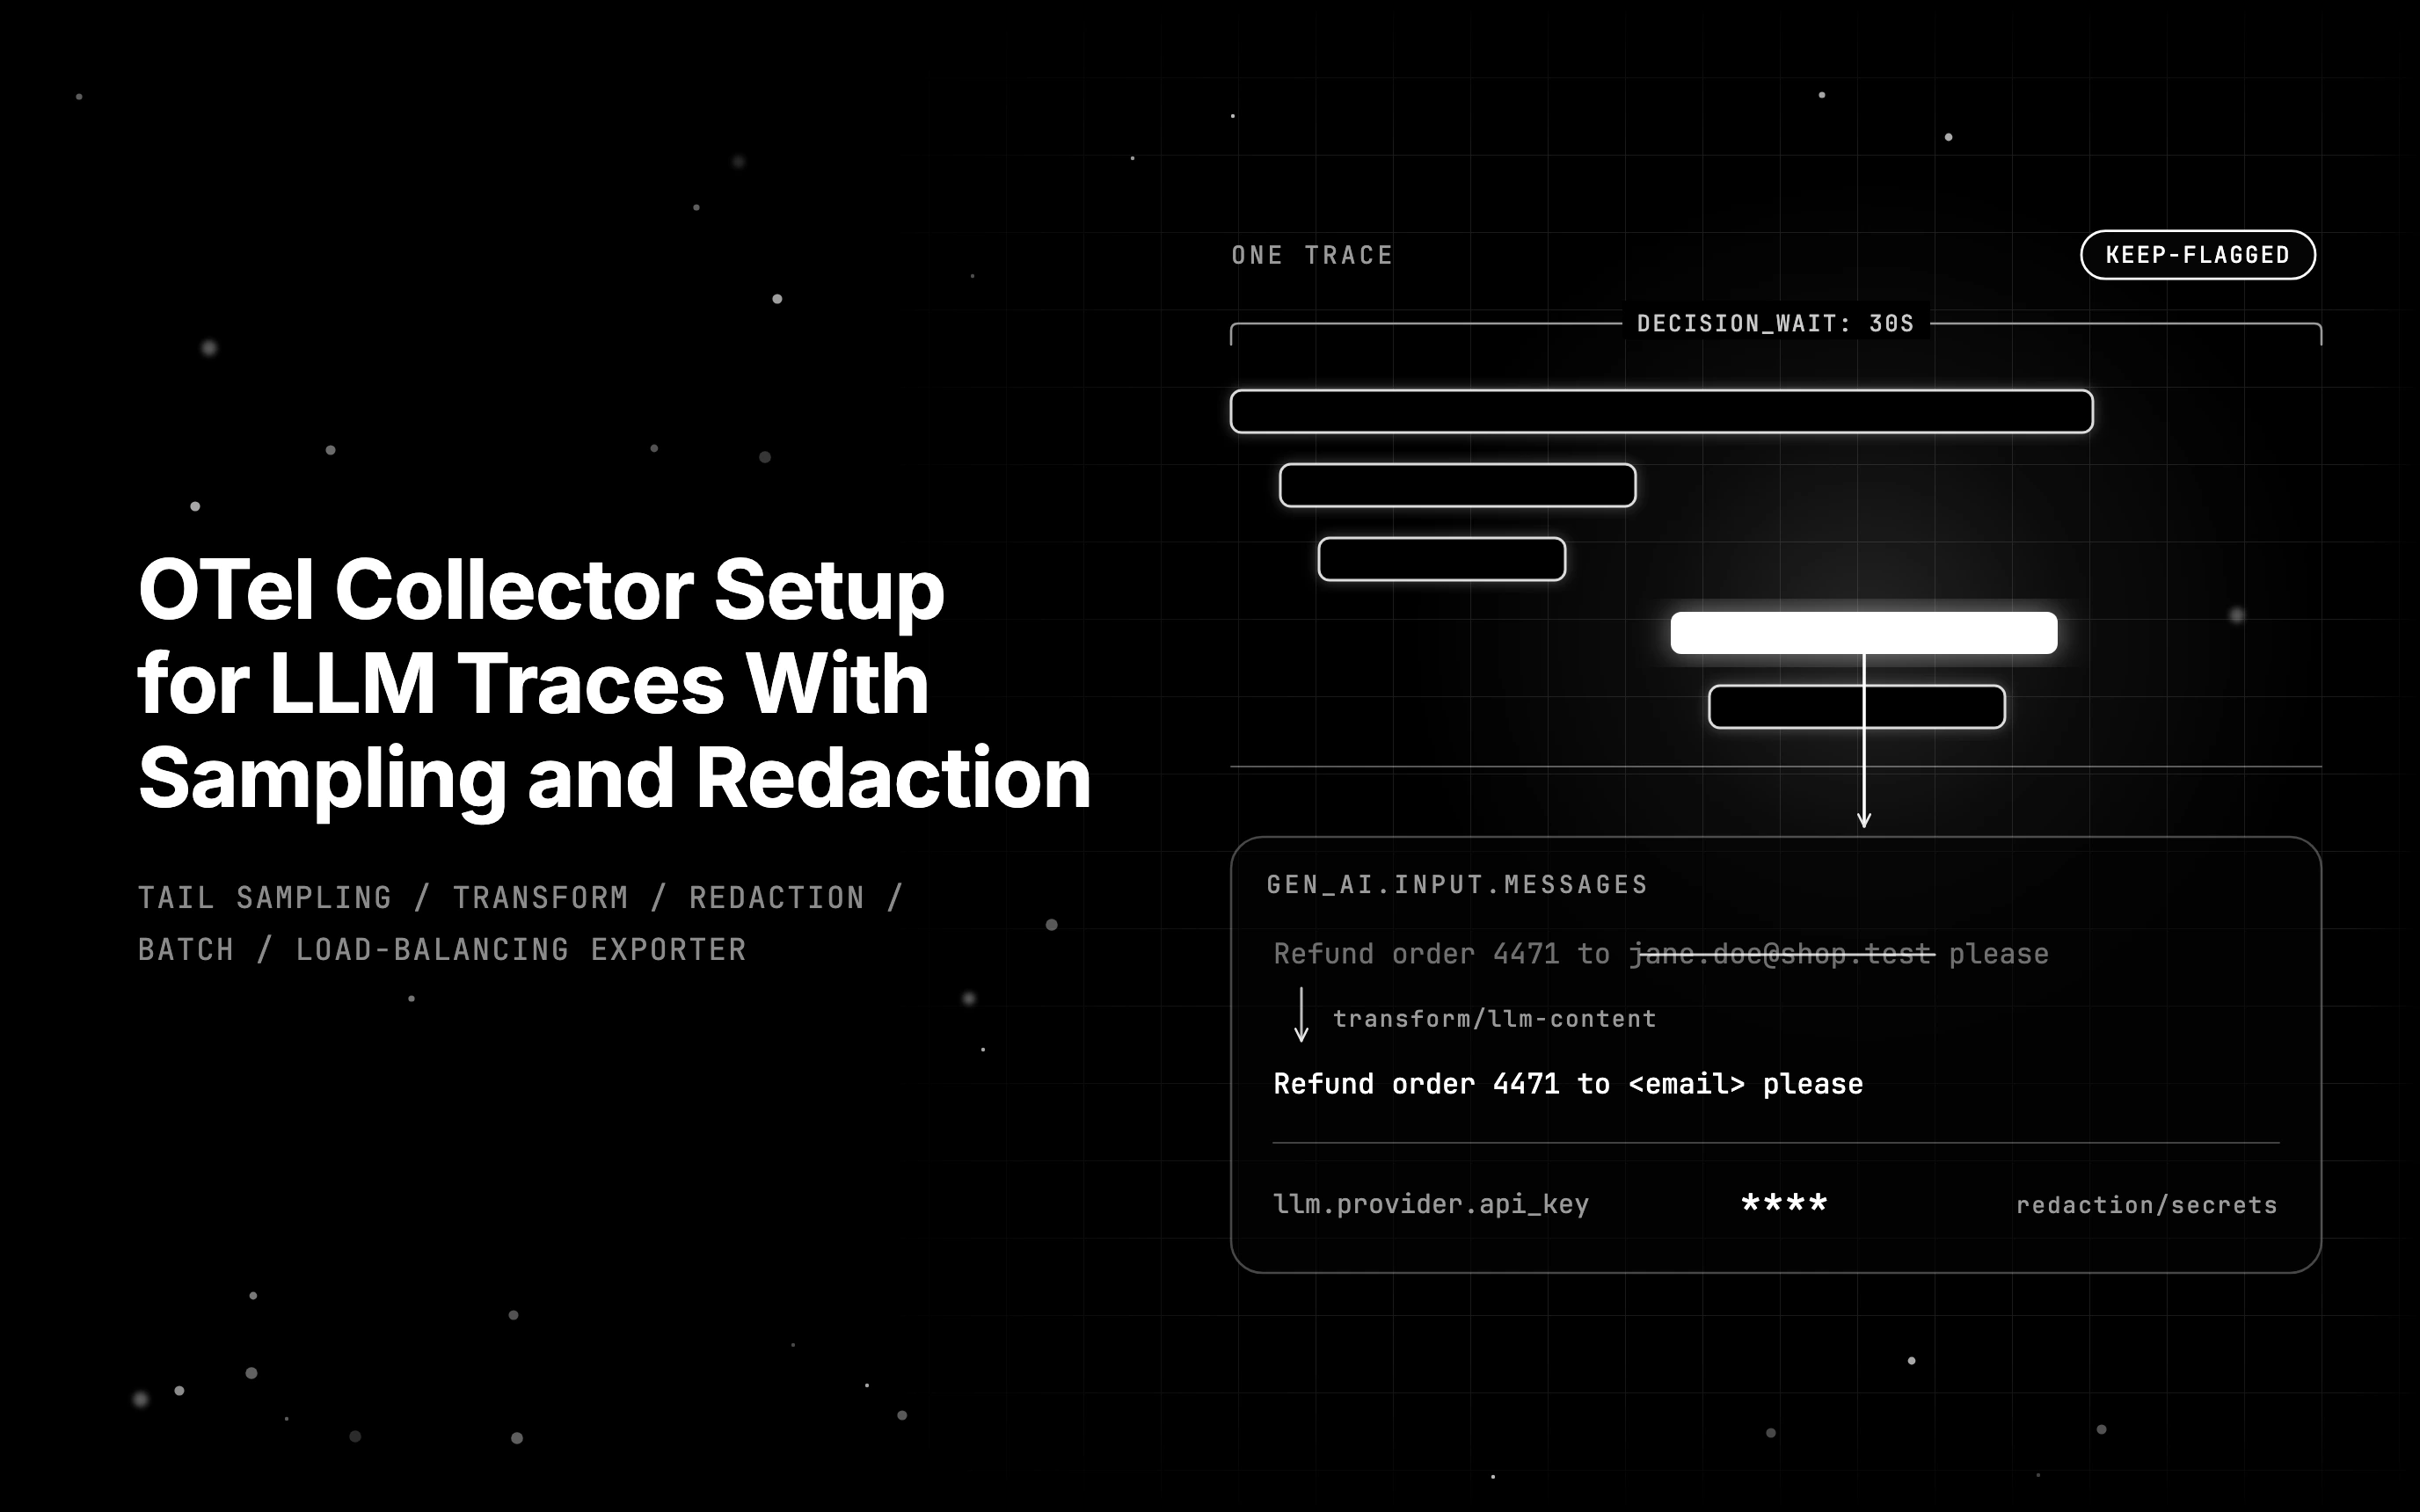
Set up an OTel collector for LLM traces: tail sampling that keeps failed and flagged runs, prompt and output redaction, batching, and two OTLP backends.