Best Prompt Observability Tools in 2026
The 6 best prompt observability tools in 2026, ranked on tracing, logging, latency and cost tracking, and debugging prompts running live in production.
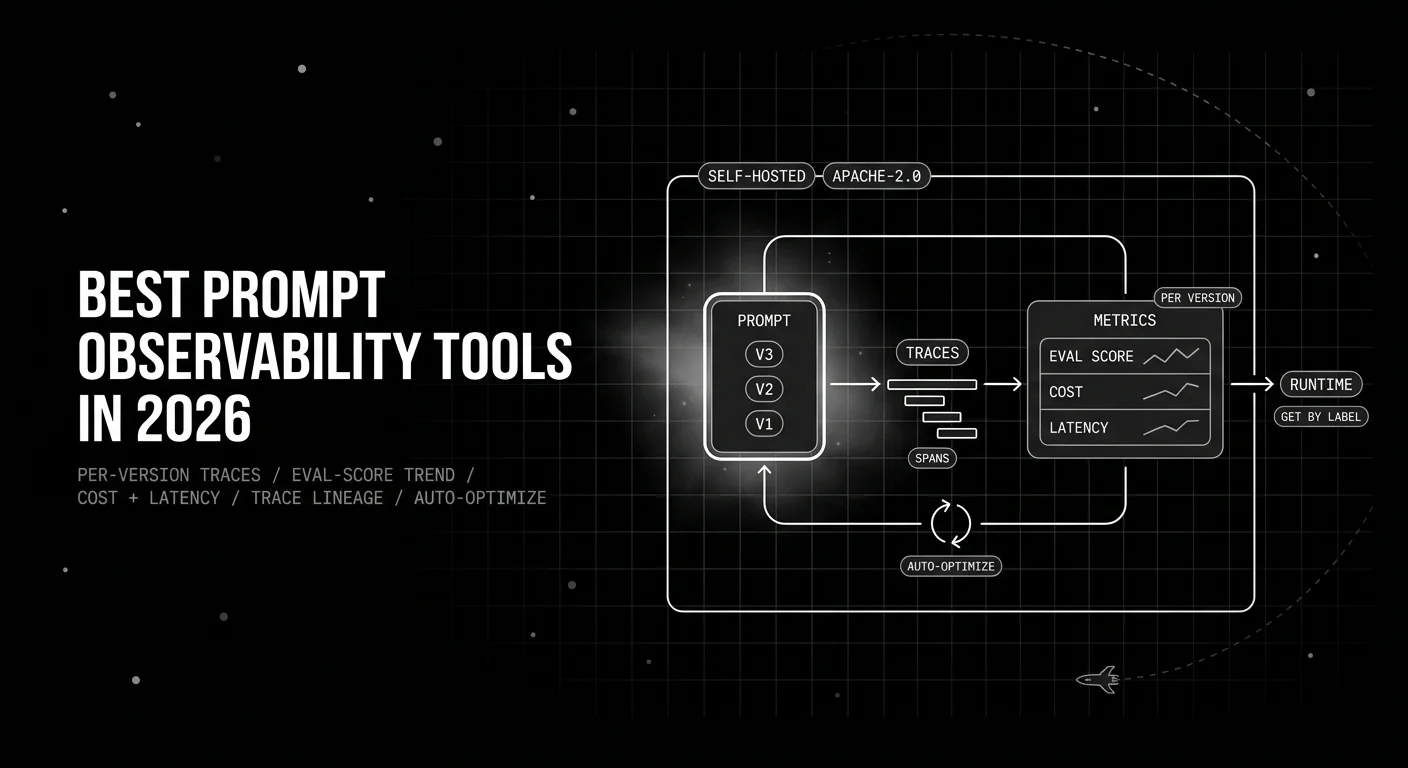
Table of Contents
A prompt regresses in production and the first question is always the same: which version did this? If your traces, eval scores, and cost numbers are scattered across an APM tool, a spreadsheet, and a billing dashboard, you cannot answer it. None of them is tied to the prompt version that produced them. This guide ranks the six prompt observability tools worth running in 2026. We score them on per-version traces, an eval-score trend you can watch move, cost and latency per version, and whether the loop closes by optimizing against what you observe.
TL;DR: 6 Prompt Observability Tools Scored on the Prompt Version
Future AGI is the strongest overall prompt observability tool for 2026 because it does not stop at a dashboard. traceAI is OpenTelemetry-native, instruments 50+ frameworks, and ties every span to the exact prompt version. Dashboards surface eval-score trends from built-in evaluators plus cost and latency per version. A CI/CD gate catches regressions, six optimizers improve the prompt, and a label swap ships the fix with no redeploy.
| Rank | Tool | Best for | Standout capability |
|---|---|---|---|
| 1 | Future AGI | End-to-end prompt lifecycle: observe, evaluate, optimize, and deploy | traceAI per-version traces, built-in evaluators, six optimizers, and label-based deployment, Apache-2.0 self-host |
| 2 | Langfuse | The open-source default for self-hosted observability | MIT core with prompts linked to their traces and Prompt Experiments |
| 3 | LangSmith | LangChain-native teams that live inside that framework | Native tracing and Experiments on a specific application version |
| 4 | Helicone | Gateway-centric request and cost observability | Strong cost and latency at the proxy, now in maintenance mode |
| 5 | Arize Phoenix | OpenTelemetry-native tracing with a prompt-to-eval loop | OTel tracing and Span Replay under a source-available license |
| 6 | PromptLayer | Request-log observability on a polished registry | Request logs that attribute back to each prompt version |
Why Does Prompt Observability Break in Production?
A prompt is the most frequently changed artifact in an LLM application, and the least observed. The model is fixed for months; the prompt is edited weekly and shipped without review. General monitoring watches the request and agent. When quality drops, it can tell you a service got slower, but not that version 7 of the summary prompt is the reason.
That missing link is what prompt observability adds: it makes the prompt version the unit of observation rather than the request. When traces, eval scores, and cost all tie to the version, a regression stops being mysterious and becomes traceable. Three requirements separate a tool that delivers this from one that just logs requests and draws generic charts.
-
The unit of observation is the prompt version. Traces, eval scores, and cost and latency all have to tie back to the specific prompt version that produced them, not to the request as a whole. That means logging the prompt template and its variables in the trace span. Tie each eval score to the version it scored, so when a number moves you know which version moved it.
-
You can watch the signals trend version over version. Observing one version is not enough; the value is in the comparison. A prompt observability tool has to show the eval-score trend and the cost and latency across versions. Then a regression shows up as a visible drop the moment the new version ships, rather than as a user complaint two weeks later. A prompt edit can quietly raise token cost or response time even when the output still looks fine. So cost and latency belong next to quality.
-
The loop closes into an optimized next version. Watching is table stakes. The harder, rarer requirement is doing something with what you saw. Feed the observed traces and scores into an optimizer, so the next version is grounded in real production behavior, not a guess. A tool that only renders dashboards leaves the improvement to a human; a tool that closes the loop turns observation into a better prompt.
Most tools in this field now trace requests and score prompts against a dataset, so those two capabilities are table stakes. The difference this scorecard rewards is the third pillar. Does the loop close, so observation produces a better prompt rather than a dashboard you read and then guess what to change next?
The Prompt Observability Scorecard
We scored every tool with the Prompt Observability Scorecard, a six-dimension rubric. It measures how well a tool ties observation to the prompt version and whether it closes the loop, not how many generic charts it can draw. Most roundups score these tools on request-level monitoring. This rubric leads with the dimensions that make observability prompt-specific: traces and metrics scoped to the version, and an optimization loop that uses them.
| # | Dimension | What we measure |
|---|---|---|
| 1 | Per-version traces | Whether trace spans log the prompt template and variables and tie to the specific version |
| 2 | Eval-score trend | Whether you can watch eval scores move version over version against a dataset |
| 3 | Cost and latency | Whether cost and latency surface per version, not just per request in aggregate |
| 4 | Trace lineage | Whether a version links back to the exact runs and spans it produced |
| 5 | Automated optimization | Whether the loop closes, optimizing the next version against what was observed |
| 6 | License and self-host | The exact license, and whether the whole platform self-hosts for free or only on Enterprise |
We do not publish a single composite score; the decision table later maps observability profiles to picks.
Here is how the six tools compare across the capabilities that vary most when the unit of observation is the prompt version.
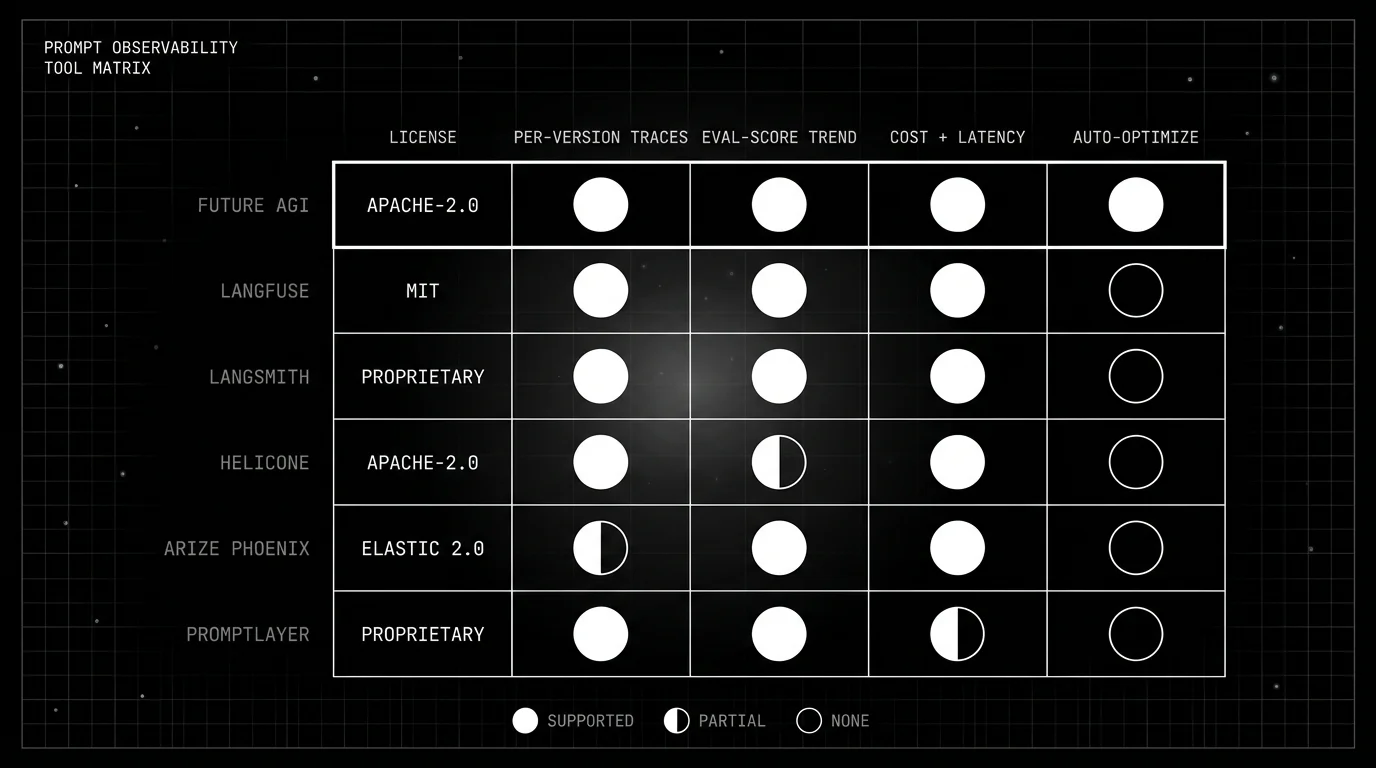
| Tool | License | Per-version traces | Eval-score trend | Cost + latency | Auto-optimize |
|---|---|---|---|---|---|
| Future AGI | Apache-2.0 core | traceAI, 50+ frameworks, OTel-native | Built-in evaluators + CI/CD gate | Per trace | Six algorithms (agent-opt) |
| Langfuse | MIT core | Linked to traces | Prompt Experiments | Full observability | Manual |
| LangSmith | Proprietary | Per app version | Experiments | Full tracing | Manual |
| Helicone | Apache-2.0 | Version history | Secondary, spreadsheet-like | Core strength | Manual |
| Arize Phoenix | Elastic 2.0 | Partial, labels under construction | Experiments | OTel-based | Manual |
| PromptLayer | Proprietary | Request logs | On the prompt page | Lighter, registry-first | Manual |
The spine of this table is the per-version traces column. Every tool here traces. But Arize Phoenix scores partial because its prompt labels are still under construction, so the per-version tie is looser. Helicone scores partial on eval-score trend since prompt evaluation is secondary to its gateway. PromptLayer scores partial on cost and latency because it is registry-first. Only Future AGI closes the loop with automated optimization.
1. Future AGI: Best Overall for Closed-Loop Prompt Observability
Quick take. Future AGI covers the full prompt lifecycle in one platform. You observe with OTel-native traceAI across 50+ frameworks and score each version against a library of built-in evaluators. You gate changes through the Evaluate CI/CD Pipeline, improve with six optimizers, and ship the fix by reassigning a label with no redeploy. Every stage runs under one Apache-2.0 license you can self-host.
Ideal for. Production AI teams that need traces, eval scores, and cost scoped to the exact prompt version, and want observation to drive improvement rather than stop at a dashboard. It fits teams running multiple versions in parallel who need a CI/CD gate to catch regressions before production. They also want an optimizer to propose the next version rather than tune it by hand.
Key strengths.
-
Per-version traces make the version the unit of observation. traceAI runs on OpenTelemetry with instrumentors for 50+ frameworks, and it embeds the prompt template and its variables in each span. That pins every trace to one specific version rather than to the request in general, so the prompt version, not the service around it, becomes the thing you observe. The scores, the cost, and the optimizer all hang off that one tie.
-
An eval-score trend you can watch move. Each version is scored on the same dataset by a library of built-in evaluators, plus any custom checks you add. The checks span quality, safety, factuality, RAG retrieval, and format. Because each score belongs to a specific version, the numbers line up into a trend you read version over version. A new version that regresses then shows up as a visible drop the moment it ships, not as a support ticket two weeks later.
-
Cost and latency sit on the same traces. Latency rides on every span, and trace analytics surface the token cost beside it, so both are observable per version instead of only in an aggregate billing view. A prompt edit that quietly raised tokens or slowed a response appears right next to the quality signal, not in a separate billing tool.
-
A gate before the regression ever enters your traces. You run those evals as a gate in your CI/CD pipeline. A bad version is turned back at the pipeline and never becomes one of the production traces you later have to debug.
-
The loop closes on what you observed. When the trend shows a version slipping, the open-source agent-opt library puts the traces and scores you just observed to work on a rewrite. You are not left to read the dashboard and guess. Six algorithms, Random Search, Bayesian, ProTeGi, Meta-Prompt, PromptWizard, and GEPA, search for a variant that scores higher against your evaluator. The next version then reflects how the prompt actually behaved live, not a hunch. Versions are immutable snapshots served through named labels, so shipping the winner is a label move rather than a redeploy.
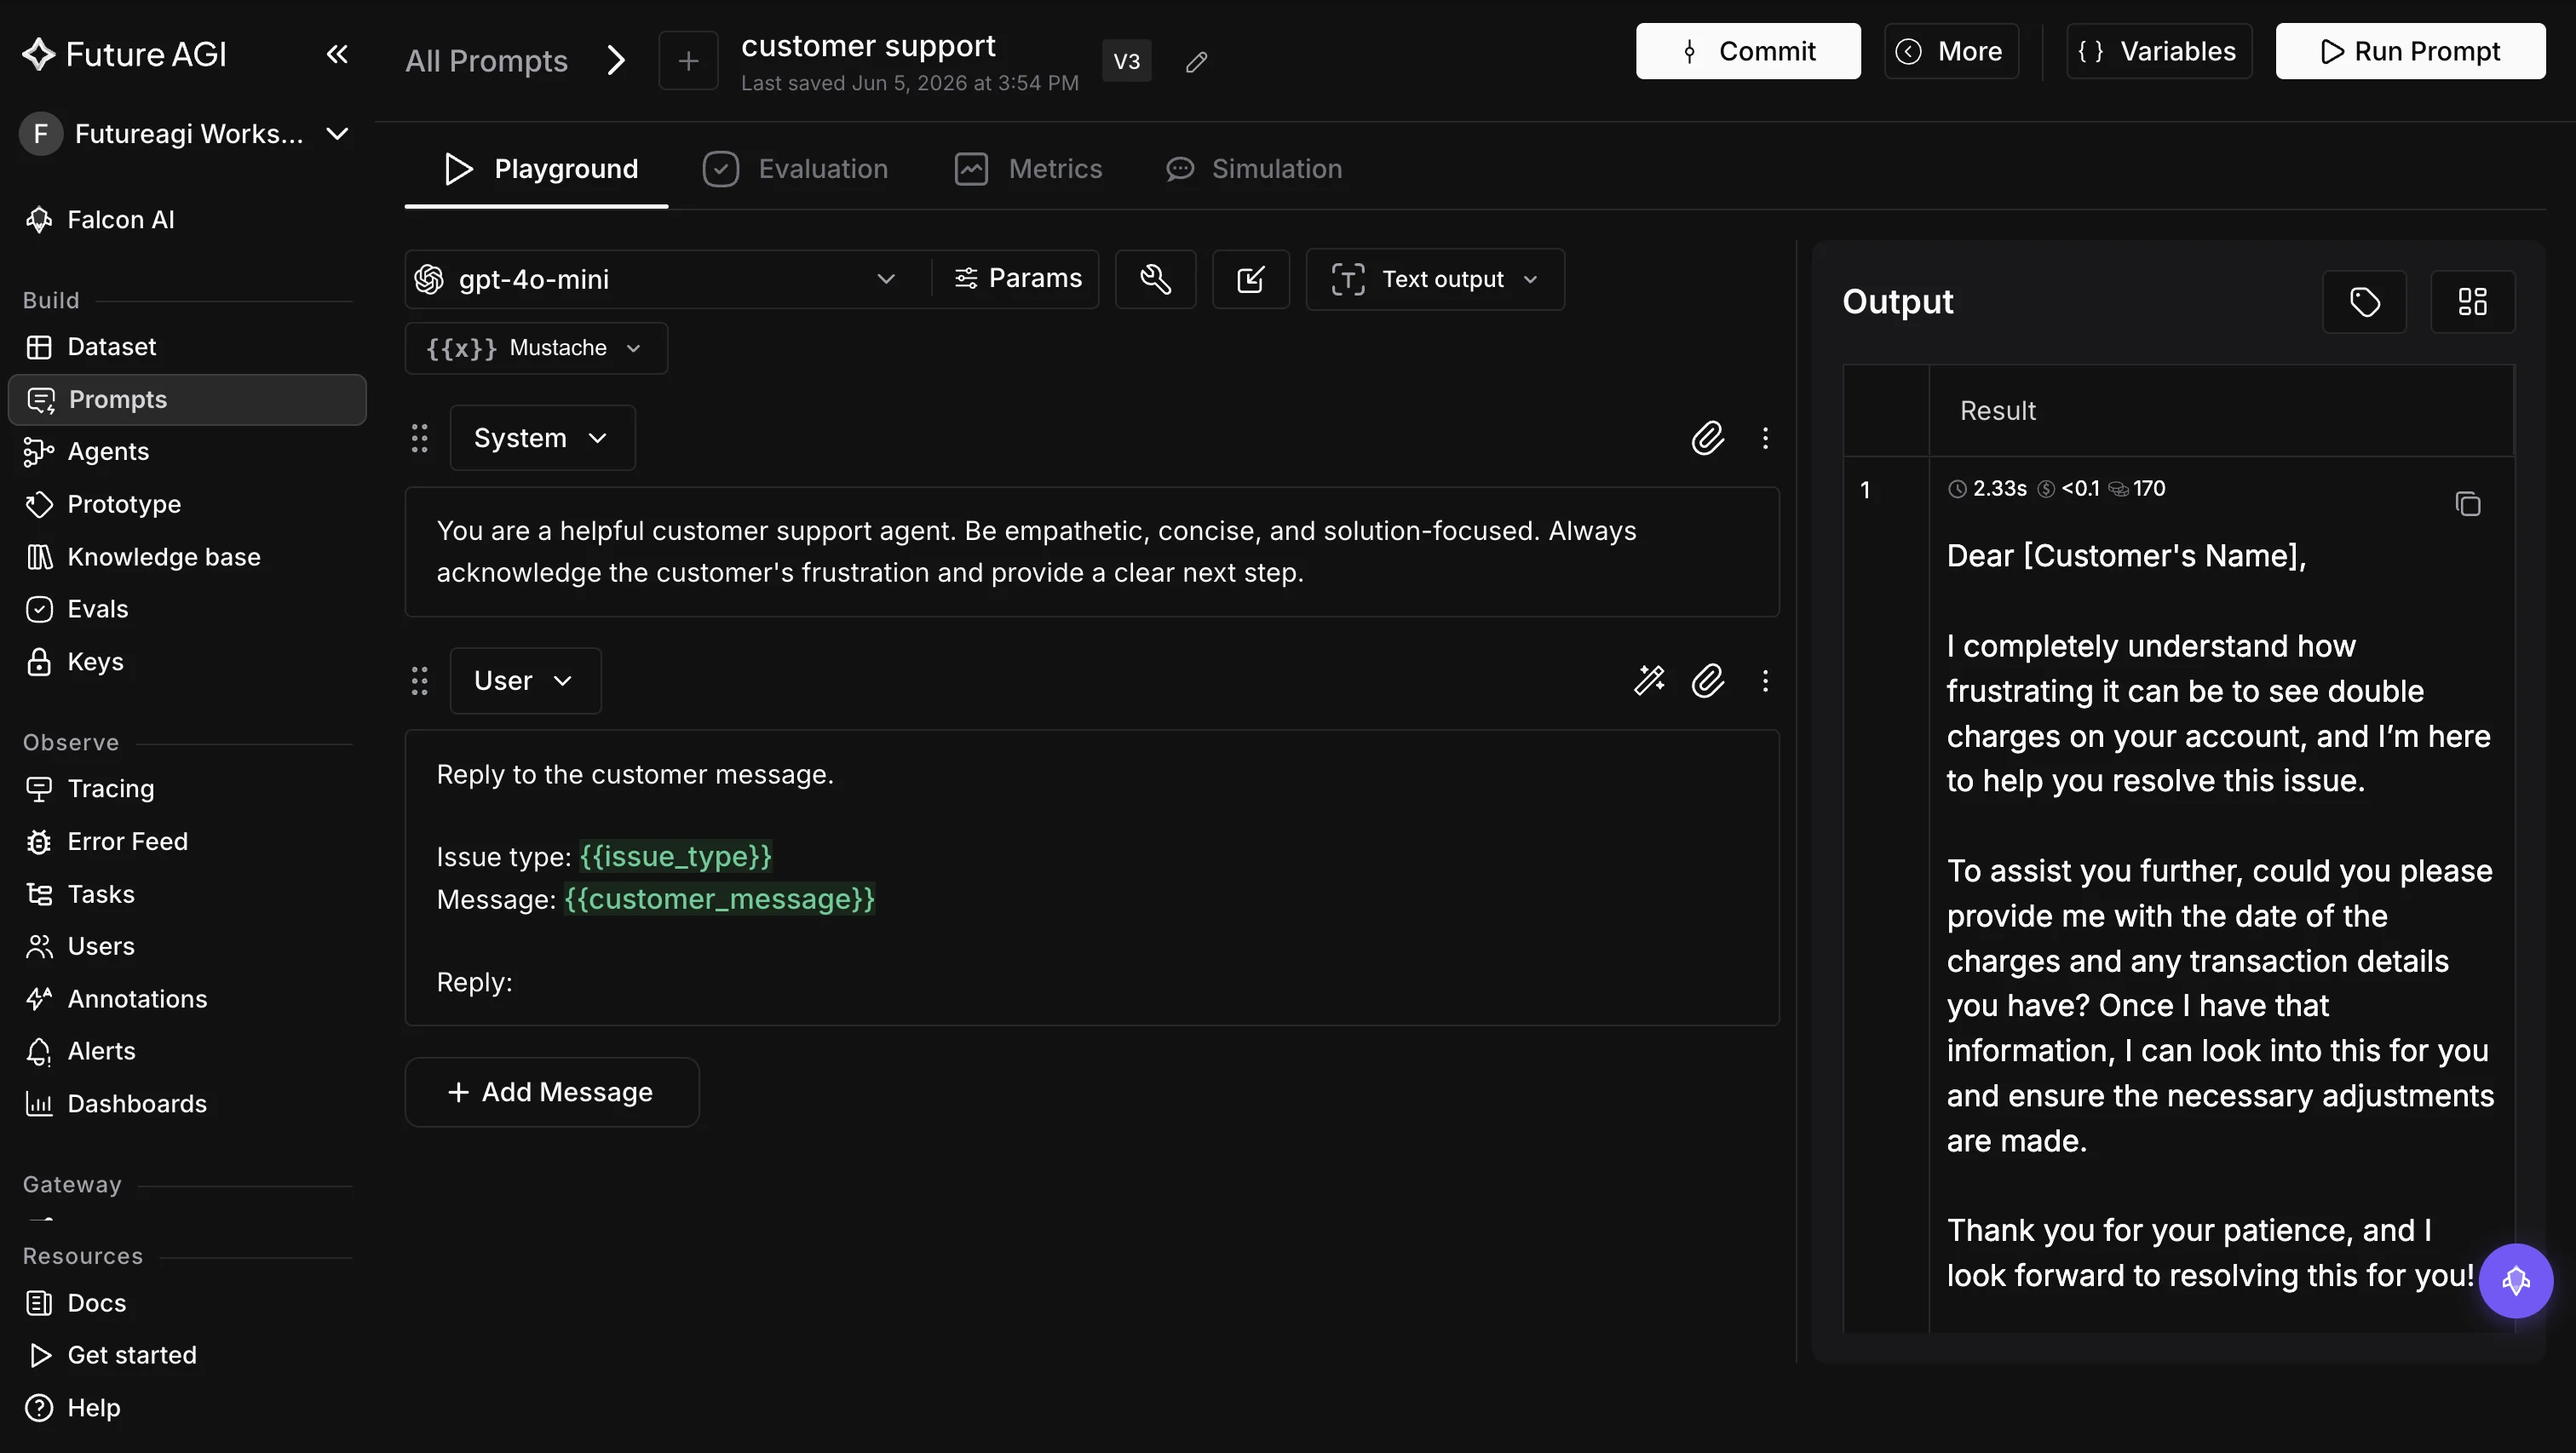
Pricing and deployment. Future AGI has a free tier, pay-as-you-go usage, and Enterprise plans on its pricing page. The core SDK and product repos are Apache-2.0 and self-hostable at no license cost via Docker Compose. The platform also offers SOC 2 Type II and HIPAA BAA on paid plans, which most proprietary rivals gate behind an Enterprise contract.
Verdict. Future AGI is the strongest overall pick for teams that want prompt observability to drive improvement, not just record it. Per-version traces, an eval-score trend from the built-in evaluator library, a CI/CD gate, six optimizers, and label-based deployment all run on one Apache-2.0 platform you can self-host. Observation and improvement share the same feedback loop instead of living in separate tools.
2. Langfuse: Best Open-Source Default for Prompt Observability
Quick take. Langfuse is the open-source platform most teams reach for first, pairing a prompt registry with full tracing in one free, self-hostable instance. Its MIT-licensed core auto-versions prompts as immutable integer versions and links each to the traces it ran in. It scores each with Prompt Experiments and surfaces cost and latency in the same monitoring view.
Ideal for. Teams that want the most widely adopted open-source option they can self-host at no license cost. Prompts, evaluation, and cost and latency all live in one instance. It suits groups with data-residency requirements that rule out a hosted-only vendor, and those who want to read the source before committing to a tool.
Key strengths.
- The MIT core self-hosts free on Docker or Kubernetes, so the registry, evaluation, and the full monitoring surface all run inside your own network with no per-seat cost. A free Hobby cloud tier lets a team start without standing up infrastructure at all.
- Prompts auto-version as immutable integers and link to the traces they produced, so a version is observable back to the exact runs it served. Labels such as production and latest map versions to environments that the runtime pulls by label.
- Prompt Experiments score a version against a dataset for the eval-score trend. Because Langfuse’s core is monitoring, cost, latency, and traces sit alongside the scores, the most mature and widely adopted of the open-source options.
Limitations. A client-side cache means a repointed label is picked up only after the cache TTL refreshes, so a freshly promoted version is observed live only after that delay. The richest enterprise controls live in the commercial Enterprise Edition rather than the MIT core, and there is no built-in automated optimization.
Pricing. A free Hobby cloud tier and free self-hosting under MIT, with paid Core, Pro, and Enterprise cloud tiers above it.
Verdict. The best open-source default for a team that wants prompts linked to their traces, evaluation, and cost and latency in one free, self-hostable instance. The tradeoff is the client-side cache TTL on label moves and the lack of automated optimization, which means improving a regressed prompt is a manual process that lives outside the tool.
3. LangSmith: Best for LangChain-Native Teams
Quick take. LangSmith is the deepest observability fit for teams already building on LangChain. It pairs mature tracing with Experiments that evaluate a specific app version against a dataset. Prompts are versioned by commit hash in a Prompt Hub and pulled by name and hash. Every run traces in detail, so observation is rich when you live inside the framework.
Ideal for. Teams already standardized on LangChain that want the most native tracing and evaluation, and are comfortable with a proprietary, hash-centric version model. The tool is a weaker fit the moment most of your stack moves outside the LangChain framework, since observation thins for services not built on it.
Key strengths.
- Tracing is mature and detailed, and Experiments evaluate a specific app version against a dataset. For teams inside the LangChain ecosystem, the eval-score trend and the traces behind it are tightly integrated.
- Prompt versioning is commit-based and immutable, with a commit hash and commit tags in a Prompt Hub, pulled by name and hash. A run can be tied back to the exact prompt commit that produced it, and named Environments promote a commit between Staging and Production.
- Cost and latency surface in the trace view alongside the spans, so the monitoring picture for a LangChain app is complete in one place without wiring a second tool.
Limitations. LangSmith is proprietary. The closed product is LangSmith itself, not the open-source LangChain framework, so self-hosting is an Enterprise arrangement rather than free. Observation is strongest inside LangChain and thins for teams on other stacks, and there is no built-in optimization, so a regressed version is one you improve by hand.
Pricing. A free Developer tier with a trace quota, a per-seat Plus tier, and custom Enterprise, with self-hosting on Enterprise.
Verdict. The best prompt observability fit for teams living inside LangChain, with deep native tracing and Experiments that tie back to the prompt commit. It is a weaker choice if you need free self-hosting, framework-neutral observability across other stacks, or a built-in optimization loop that writes the next version for you.
4. Helicone: Best Gateway-Centric Observability, Now in Maintenance Mode
Quick take. Helicone comes at prompt observability from the gateway: its core is request logging, cost and latency, and an HQL query layer. Prompt management is a secondary surface, where you compose in a Playground, save with commit histories and tags, and reference a prompt by ID. It is Apache-2.0 and free to self-host, with genuinely strong cost and latency monitoring. The decisive caveat for 2026 is status.
Ideal for. Teams that want strong, free, self-hostable request and cost observability with a gateway at the center, and can accept that the project is no longer adding features. It suits organizations routing all traffic through a proxy that want per-version cost and latency without adopting a new tracing framework.
Key strengths.
- Monitoring is the heritage, so request logging, cost, and latency are a real strength, queryable through HQL. Apache-2.0 self-hosting means the whole surface runs free inside your own network.
- Prompt management, while secondary, is real: you save prompts with commit histories and tags, then reference them by prompt ID in the gateway with no code changes. Helicone also auto-detects production prompt changes and keeps a version history, so a version is observable back to its requests.
- The gateway-centric model means monitoring is captured at the proxy layer with minimal wiring. That is a fast path to per-version request and cost data for a team that routes through it.
Limitations. The decisive one is maintenance mode. Since the Mintlify acquisition in March 2026, Helicone ships security and bug fixes only, so its prompt observability will not deepen. Prompt evaluation is secondary and spreadsheet-like, the free tier caps at 10,000 requests per month with one seat, and there is no built-in optimization.
Pricing. A Hobby tier at no cost with a monthly request cap and one seat, paid Pro and Team tiers, and custom Enterprise, with free Apache-2.0 self-hosting.
Verdict. Strong monitoring-first heritage with solid cost and latency tracking and free Apache-2.0 self-hosting. Maintenance-mode status means prompt observability will not deepen beyond security and bug fixes. It is a stable choice only if request and cost data are the priority and you do not need new evaluation features to arrive.
5. Arize Phoenix: Best OpenTelemetry-Native Tracing With a Prompt-to-Eval Loop
Quick take. Arize Phoenix is an OpenTelemetry-native observability and evaluation tool with a real prompt surface. That surface spans Prompt Management to create, store, and deploy prompts, plus a Prompt Playground and Span Replay. A Playground-to-dataset-to-Experiment loop then connects a prompt to its evaluations. Its tracing is strong and standards-based, and it self-hosts free.
Ideal for. Teams that want OpenTelemetry-native tracing with a genuine prompt-to-evaluation loop and can accept a source-available license and a per-version surface that is still maturing. It fits engineering teams that want to avoid vendor-specific wiring and prefer standards-based tracing. That holds even while the prompt label and metadata features are still under construction.
Key strengths.
- Tracing is OTel-native and strong, with Span Replay to re-examine a run. Request-level monitoring is mature and standards-based, which matters if you want to avoid vendor-specific wiring.
- The prompt-to-eval loop is genuine: a prompt in the Playground feeds a dataset that drives an Experiment with Evaluators. The eval-score trend is well connected to the prompt that produced it.
- Versions are auto-created on save and pulled by a production tag, so there is a working promotion path. The whole tool self-hosts free under the Elastic License 2.0, with real community adoption.
Limitations. The license is Elastic License 2.0, source-available but not OSI open-source, so you cannot offer it as a managed service. Prompt labels and metadata are still under construction, which is why the per-version tie scores partial. Tracing is strong, but binding it to a specific labeled prompt version is less mature than the per-request tracing. Cloud pricing is opaque, and there is no built-in optimization.
Pricing. Phoenix is free and self-hostable under the Elastic License 2.0, and Phoenix Cloud has a free tier, with paid tiers not publicly listed and deeper governance in the separate Arize AX product.
Verdict. The strongest OTel-native tracing in this comparison, with a genuine prompt-to-eval Experiment loop. For pure prompt observability it is held back by a source-available license and a per-version label surface that is still maturing. A strong choice when avoiding vendor-specific wiring matters more than a polished version UI or a built-in optimizer.
6. PromptLayer: Best Request-Log Observability on a Polished Registry
Quick take. PromptLayer is a registry-first platform where prompt management is the whole product, and its observability comes from request logs that tie back to the prompt version that served them. You get immutable versions with commit messages and diffs, plus Release and Dynamic Labels for promotion. Evaluations and Datasets live on the prompt page, with a clear log of which version served each request.
Ideal for. Teams that want a polished, non-engineer-friendly registry where request logs and evaluations tie back to each prompt version, and are willing to pay for cloud. It suits organizations where the prompt author is not always an engineer. Visual release control, commit messages, and version diffs all need to be legible to a product manager.
Key strengths.
- Request logs tie back to the version that served them, so observation is traceable to the prompt version. The registry itself is first-class: commit messages, version diffs, and a clean linear history make every change legible.
- Evaluations and Datasets live on the prompt page, so the eval-score trend sits next to the version it scored. A non-engineer can read it, which suits teams where the prompt author is not always an engineer.
- Release Labels and Dynamic Labels map a version to environments such as prod and staging, and the runtime pulls by label. The log shows which label served each request, a clean audit trail.
Limitations. Observability is secondary to the registry, so cost and latency are lighter than the monitoring-native tools, which is the dimension it scores partial on. The platform is proprietary with no free self-hosting, and evaluation cells are capped on the low tiers. The version model is linear with no branch or merge, and there is no built-in optimization.
Pricing. A free tier, a paid Pro tier, and a paid Team tier in the cloud, with self-hosting available only on Enterprise.
Verdict. The best request-log observability on a polished registry, with clean version diffs, commit messages, and evaluations on the prompt page that non-engineers can read and act on. It is a weaker fit if you need deep cost and latency observability, free self-hosting, or a built-in optimization loop rather than a structured release workflow.
Which Prompt Observability Tool Should You Choose?
There is no single winner for every team. Match the tool to what you most need to observe, whether you intend to act on it, and whether your license and hosting constraints rule out proprietary options. The table below maps common observability needs to the tool that serves them best.
| If you need | Choose | Because |
|---|---|---|
| Per-version traces, eval-score trend, and cost, with a closed optimization loop | Future AGI | The only tool that ties all three to the version and optimizes against what you observe, Apache-2.0 and self-hostable |
| The most widely adopted free open-source default | Langfuse | MIT core, free self-host, prompts linked to their traces, with evaluation and cost in one instance |
| The deepest fit inside LangChain | LangSmith | Native tracing and Experiments on a specific application version, hash-based versioning |
| Free, gateway-centric request and cost observability | Helicone | Apache-2.0 self-host with strong cost and latency, accepting maintenance mode and secondary evaluation |
| OpenTelemetry-native tracing with a prompt-to-eval loop | Arize Phoenix | Strong OTel tracing and an Experiment loop, accepting Elastic 2.0 and an in-progress version surface |
| Request-log observability on a polished registry | PromptLayer | Logs and evaluations attribute to the version, if you will pay for cloud |
Tracing and evaluation have converged, so the decision comes down to two questions: is observation scoped to the prompt version, and does the loop close? Langfuse is the open-source default; LangSmith fits better inside LangChain; Arize Phoenix has strong OTel-native tracing under a source-available license; Helicone is in maintenance mode. Only Future AGI closes the full loop: per-version traces, built-in evaluators, a CI/CD gate, six optimizers, label-based deployment, Apache-2.0.
How Do You Roll Out Prompt Observability Without Breaking Production?
Picking a tool is the easy part. These five practices keep prompt observability attributable to the version and turn what you see in production into a better next prompt rather than a dashboard you read once and close. They apply regardless of which tool you pick from the table above.
- Make the prompt version the unit of observation. Decide up front that you are observing the prompt version, not just the request. Pick tooling that ties traces, scores, and cost to a specific version, so a regression is traceable instead of mysterious.
- Log the template and variables in every trace span. Instrument the serving path so each span records the prompt template and its variables, the way traceAI does. Every run then ties back to the exact version that produced it, and lineage is never lost.
- Trend eval scores and cost and latency together. Score each version against a fixed dataset and watch the eval-score trend version over version, and put cost and latency next to it. A prompt edit can raise tokens or response time even when the output still looks fine.
- Gate a new version on its evaluation before it ships. Compare the candidate against the current production version on the same dataset. Run that eval as a CI/CD gate, so a regression fails the build instead of reaching the traces you debug later.
- Close the loop with optimization. Once the three signals trend, feed the observed traces and scores into an optimizer. The next version is then grounded in real production behavior, which turns observation into an improved prompt instead of a report.
Where Future AGI Fits in Your Prompt Observability Stack
Observability starts with one question when a prompt regresses: which version did this? Picture the answer scattered across an APM tool, a spreadsheet, and a billing dashboard, none tied to the version that caused it. On Future AGI everything shares one tie. traceAI links every span to the version that produced it, and the eval-score trend, cost, and latency sit on those same traces. A CI/CD gate keeps a known regression off them in the first place. So the question answers itself: the version is on the trace. And since agent-opt reads those traces to build the next version, the answer becomes the fix, shipped by moving a label. That is the difference between a dashboard you read and a loop that improves the prompt. Open Future AGI and trace your first prompt version, or self-host the open-source stack.
Frequently Asked Questions About Prompt Observability
What Is Prompt Observability?
Prompt observability treats the prompt version as the unit of observation. It captures the traces, eval scores, and cost and latency each version produces in production. It is narrower than general LLM observability, which watches requests and systems as a whole. Every span, score, and metric ties to the specific version that generated it, so a regression is traceable to the version that caused it.
Which Prompt Observability Tool Is Best in 2026?
Future AGI is the strongest overall pick. It ties per-version traceAI tracing, a built-in evaluator library, a CI/CD gate, six optimizers, and label-based deployment into one Apache-2.0 loop. Observation drives improvement rather than stopping at a chart. Langfuse is the open-source default. LangSmith is deepest inside LangChain. Helicone has observability heritage but now ships fixes only. Arize Phoenix delivers strong OpenTelemetry-native tracing under a source-available license. PromptLayer adds request-log observability to a polished registry.
What Are the Best Open-Source Prompt Observability Tools?
Future AGI, Langfuse, and Helicone are the self-hostable options, though the license differs. Future AGI’s core repos are Apache-2.0 and cover traceAI tracing, a built-in evaluator library, and optimization. Langfuse ships an MIT core with prompts linked to their traces. Helicone is Apache-2.0 but in maintenance mode after its Mintlify acquisition. Arize Phoenix self-hosts free under Elastic License 2.0, which is source-available rather than OSI open-source. LangSmith and PromptLayer are proprietary, so self-hosting requires an Enterprise contract.
How Is Prompt Observability Different From LLM Observability?
LLM observability watches the request, agent, and system: latency, spans, errors, and cost across the whole application. Prompt observability narrows the unit of observation to the prompt version, asking not how the service behaved but how this specific version behaved. The payoff is attribution: when a metric regresses, you know which version caused it and have the eval-score trend to improve the next one.
Does Future AGI Support Prompt Observability and Optimization?
Yes, and the combination is the point. traceAI is OpenTelemetry-native, instruments 50+ frameworks, and logs prompt templates in every span so traces tie to the exact version. The built-in evaluator library scores each version alongside cost and latency. Then the agent-opt library closes the loop with six optimizers that return a higher-scoring next version, all Apache-2.0 so you self-host the whole feedback loop at no license cost.
Frequently Asked Questions
What Is Prompt Observability?
Which Prompt Observability Tool Is Best in 2026?
What Are the Best Open-Source Prompt Observability Tools?
How Is Prompt Observability Different From LLM Observability?
Does Future AGI Support Prompt Observability and Optimization?
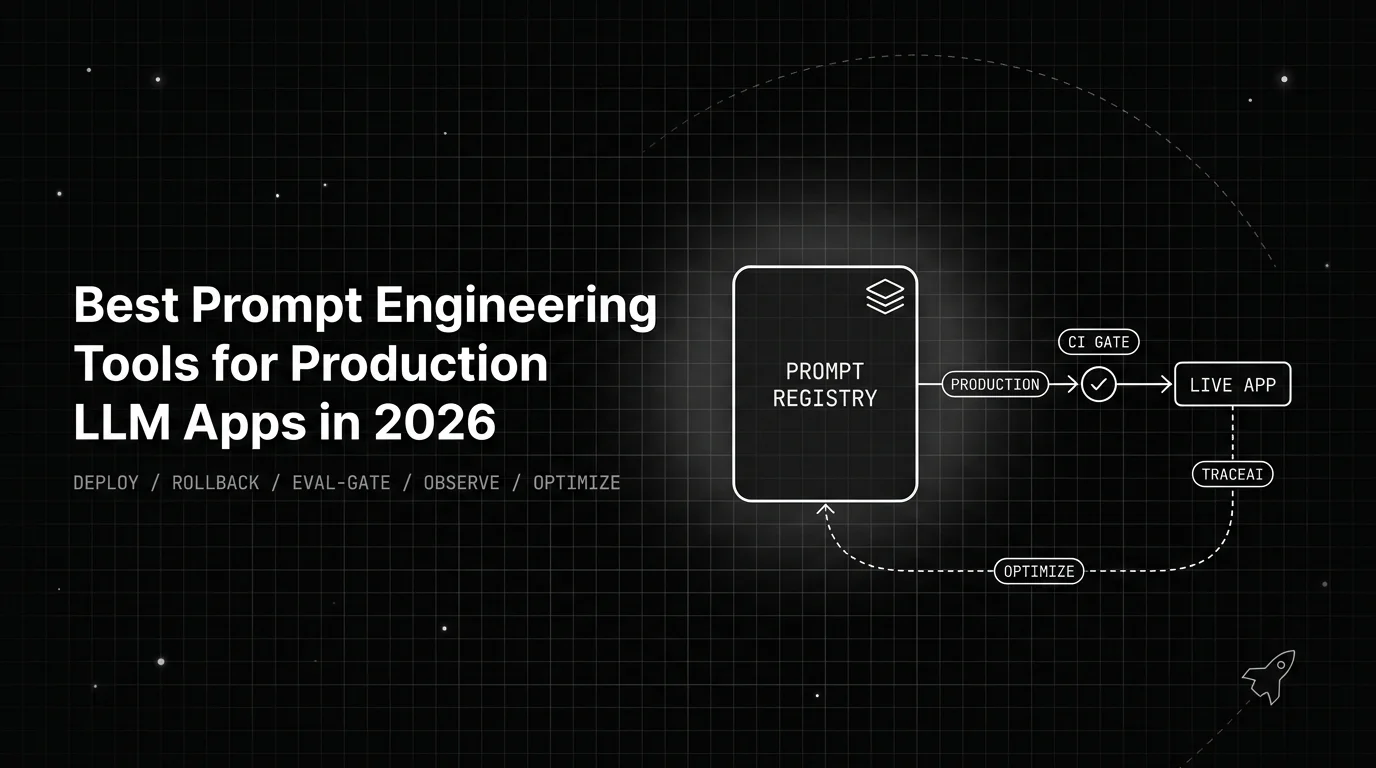
The 6 best prompt engineering tools for production LLM apps in 2026, ranked on versioning, evaluation, CI gates, tracing, and quick rollback in production.

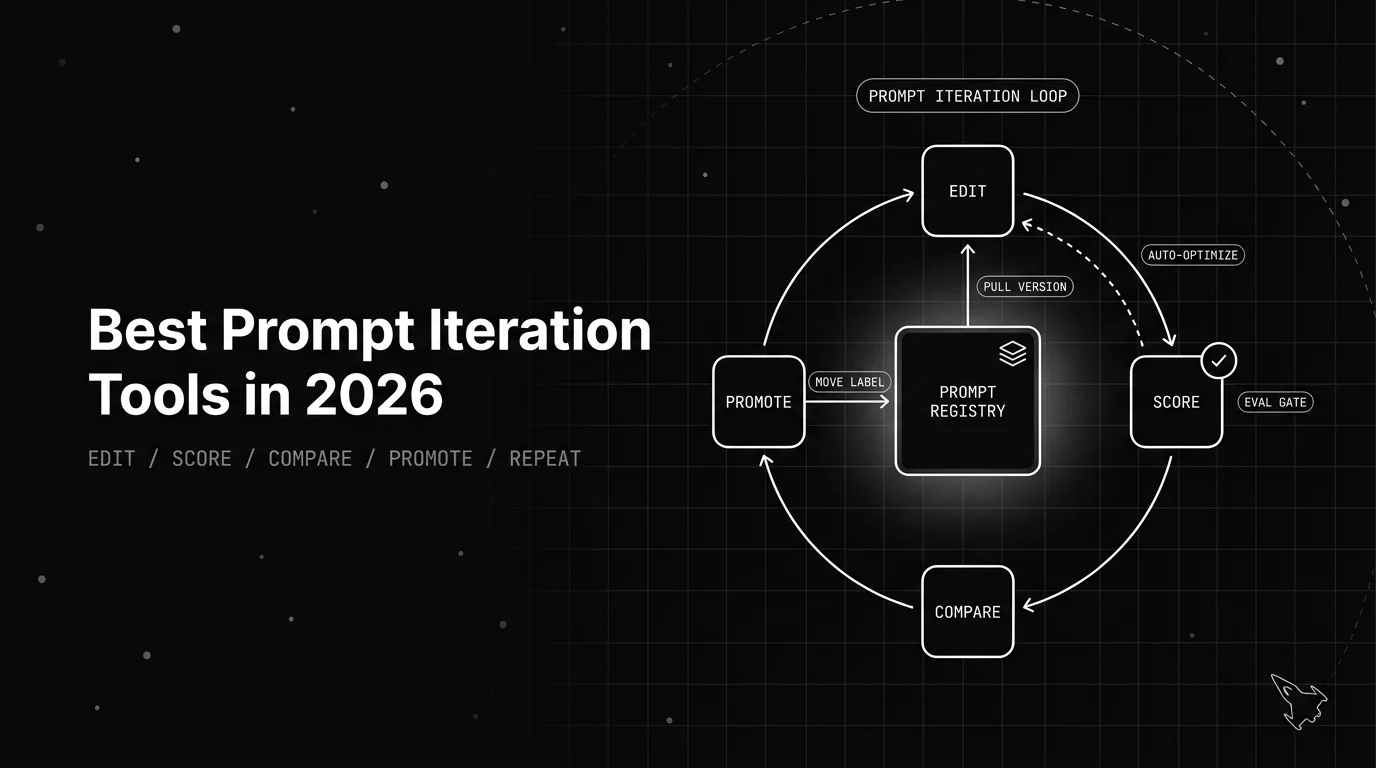
The 7 best prompt iteration tools in 2026, ranked on fast editing, versioning, evaluation, and comparing prompt changes before you ship them to users.
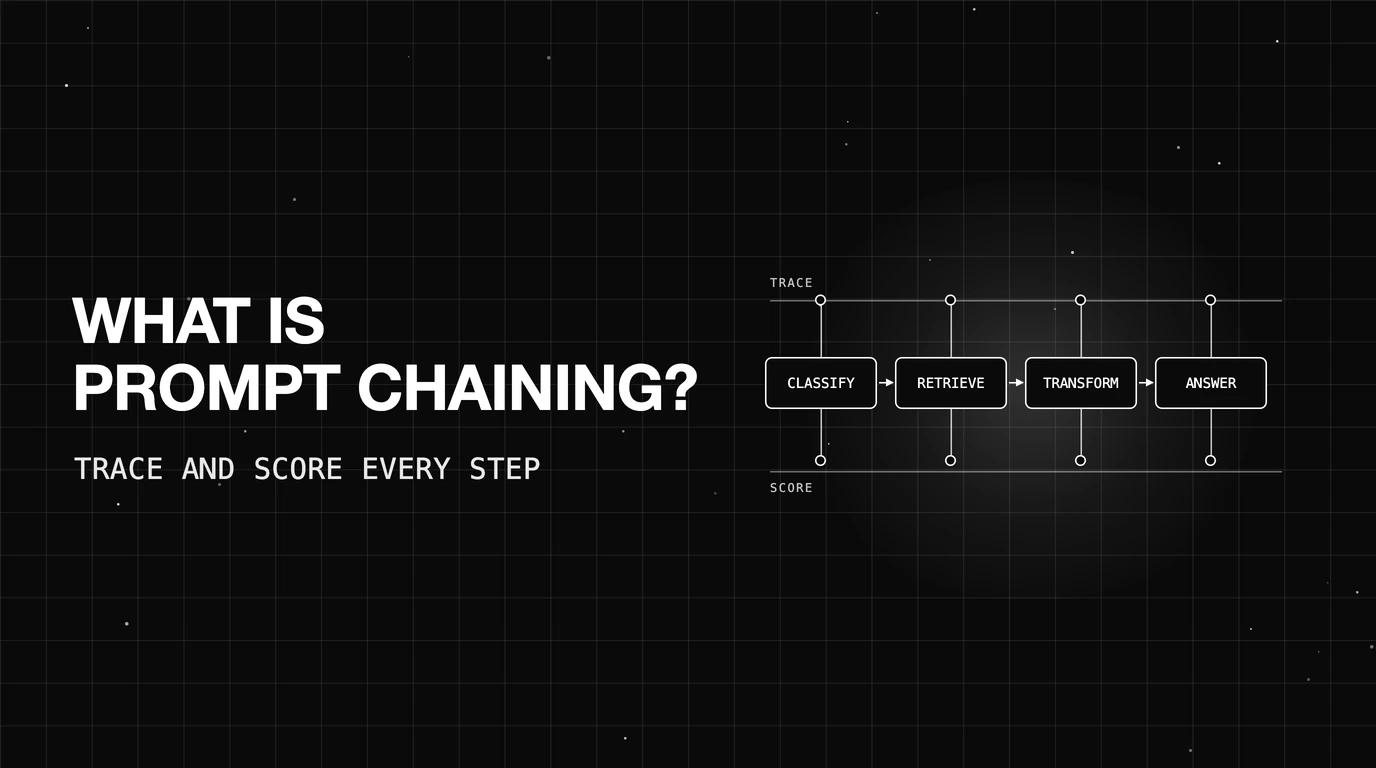
A chain that returns a clean answer can still be wrong in the middle. Here is how to record each link as its own span and put a score on it.