MCP Inspector: What It Misses When Debugging MCP Servers
MCP Inspector is the right first stop for debugging MCP servers. Here is what it cannot see once real agents call your server, and what fills the gap.
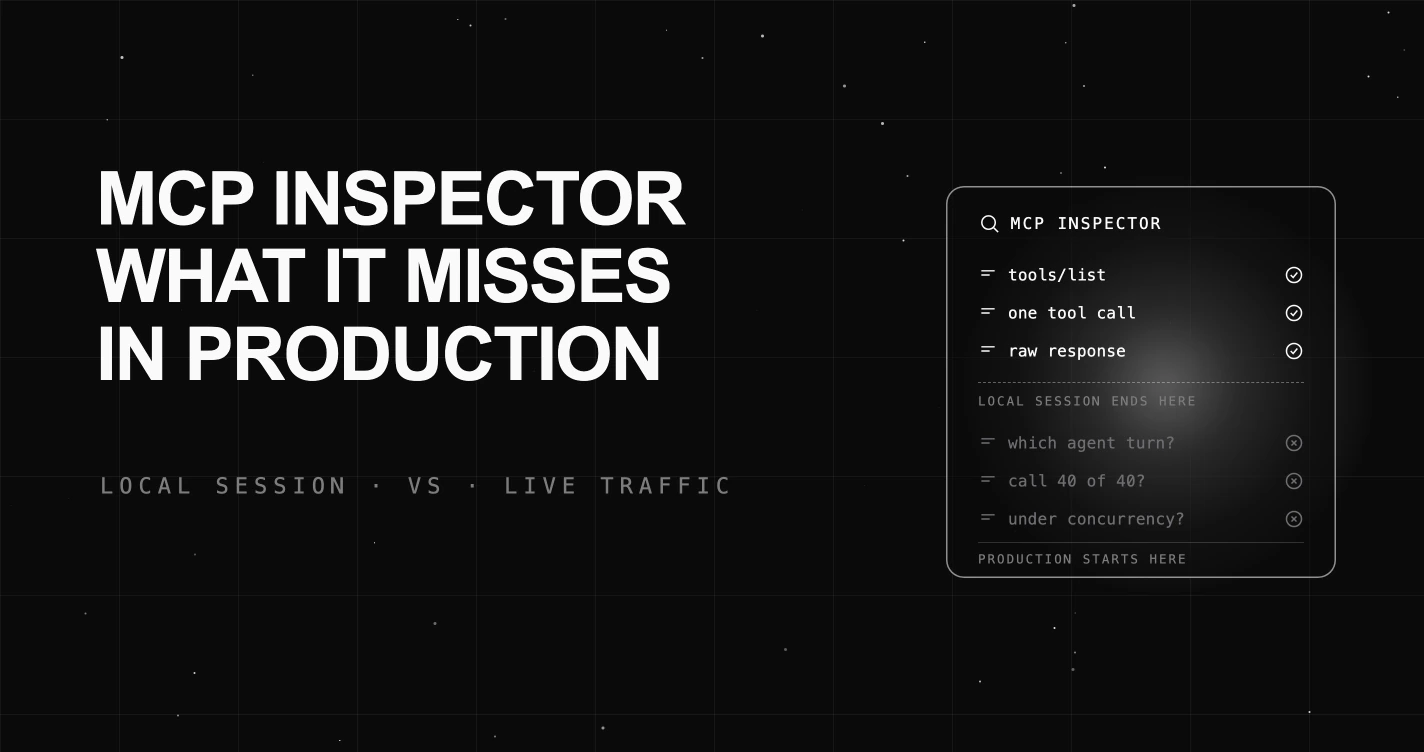
Table of Contents
An agent calls your search tool and gets nothing back. Not an error: an empty array, wrapped in a valid JSON-RPC success result, with no isError flag on it. The model reads the empty result and tells the user, helpfully, that there were no matches and they should try broadening the search.
So you open MCP Inspector, connect to the same server, pick the same tool, fill in the form, and hit run. It returns results immediately.
The bug is real, and Inspector cannot reproduce it. A parameter had been renamed from query to search_query. Your agent was still sending the old name, the server ignored the unknown field, applied an empty default, and answered honestly.
The short version: Inspector is local, interactive, single connection, and it connects as its own client. Call that the Inspector boundary. Every failure that depends on who called, what they actually sent, how many callers there were, or how the model read the result falls outside it.
What Is MCP Inspector Actually For?
This is not an argument against the tool. Inspector is good, and it is the correct place to start.
Its own documentation describes it as “an interactive developer tool for testing and debugging MCP servers”. The official debugging guide lists it first, with a flat instruction: “This should be your first stop.”
Everything below describes Inspector version 2.0.0, released 2026-07-28, and the MCP specification revision of the same date. Checked as of 2026-07-31.
The release notes are precise about the shape of it: v2 “ships as a single package with three clients … over a shared @inspector/core runtime, so all three behave identically.” Those three are a web UI, a scriptable CLI, and an Ink-based TUI, and all of them run through one binary, per the repository README:
npx @modelcontextprotocol/inspector          # web UI (default)
npx @modelcontextprotocol/inspector --cli    # CLI
npx @modelcontextprotocol/inspector --tui    # TUI
It lists resources, prompts, and tools, renders their schemas, invokes any of them with arguments you supply, and shows the notification stream. The debugging guide describes it as transport agnostic, connecting to “stdio or Streamable HTTP servers”.
A per-server protocolEra field, documented in the repository as taking legacy (the default), auto, or modern, lets you negotiate either protocol era against the same server.
The CLI mode matters more than it looks. It makes tool, resource, and prompt invocation scriptable, which means Inspector belongs in CI, not just on your laptop.
Its limits are structural rather than deficiencies. Inspector is local, interactive, single connection, and it connects as its own client. Every gap below is a consequence of one of those four properties, which is what makes this a boundary rather than a list of missing features.
Which MCP Failures Does Inspector Miss?
Sorting by cause rather than by symptom makes the boundary easy to keep in your head. Each row traces back to one of the four properties above.
| Failure | Which property causes the blind spot | What sees it instead |
|---|---|---|
| Schema drift between agent and server | Own client: it holds no cached definition, so it always builds its form from the live schema | Canonicalised schema hash at connect, structurally diffed in CI |
| Wrong tool chosen, or a correct result misread | Interactive: a human picks the tool and reads the result, so no model judgement is under test | Trace with the agent turn attached |
| Correlation across an input-required retry | Own client: it is not the caller whose turn you need to correlate to | traceparent propagated in _meta |
| Cost of definitions before anyone calls | Own client: not a model client, so it never assembles the pre-prompt where the cost lands | Token accounting at the gateway |
| Instructions arriving inside a tool response | Own client: the response is rendered for you, never injected into a model context | Response validation at the call boundary |
| Lock contention, pool exhaustion, per-caller rate limits | Single connection: one caller cannot contend with a second | Load tests |
| Tool-name collisions across two servers | Single connection, so never two servers mounted side by side | Trace with the server name on each span |
| A credential expiring mid-session under a real client | Own client, with its own OAuth flow and its own refresh logic | Long-lived session tests against the client that will run in production |
One term in that table is worth glossing: an input-required retry is the spec’s multi-round-trip case, where a server answers a call by asking the caller for more input rather than returning a result, so a single logical operation spans several requests.
The rest of this post takes the largest of these in turn.
Why Does a Tool Work in Inspector but Fail With Your Agent?
Start with the opening scenario, because it generalises. The failure was schema drift: a tool definition changed, and a caller was still holding the old one.
Three things have to line up for it to stay invisible. The server accepts unknown parameters instead of rejecting them. The framework passes the model’s arguments straight through without validating them. And the model, handed an empty but well formed result, writes a plausible explanation for it.
Inspector cannot participate in that failure. It reads the live schema and generates the form from it, so drift never manifests in the one place you are looking. The tool is not lying to you. It is answering a different question than the one you have.
The fix is a baseline. Canonicalise each tool schema at connect time (sort the keys), hash it, and store it. The hash is only a change detector, and will trip on a reworded description: it tells you that the server moved, never what moved. So on any change, run a structural diff and classify renames, type changes, and newly required fields as breaking. Note the limit even then. A server-side baseline tells you the server changed, not whether every caller holding a cached definition followed, and that half needs the caller in view.
Then make servers strict. The version that hides is the permissive one, where the drifted parameter is optional and carries a default:
from pydantic import BaseModel, ConfigDict

# Before: unknown params are ignored and the default answers instead.
class SearchArgs(BaseModel):
    search_query: str = ""      # a caller still sending `query` gets this
    limit: int = 10

# After: unknown params raise, and the parameter is required.
class SearchArgs(BaseModel):
    model_config = ConfigDict(extra="forbid")
    search_query: str
    limit: int = 10
The TypeScript equivalent is z.strictObject() (Zod’s older .strict() is deprecated in Zod 4). Zod’s default is to strip unknown keys silently and Pydantic’s is to ignore them, both quiet, which is the whole problem. Strictness only helps callers if it reaches the advertised JSON Schema as additionalProperties: false.
One honest limit on the fix. A validation error inside a tool is conventionally returned as a successful tools/call result with isError: true, and a framework that hands that straight back to the model will get it narrated about as plausibly as the empty array was. Strictness moves the failure earlier; it reaches a human only if your client raises on isError instead of passing it along. Which is the second reason the trace matters.
Which Failures Only Appear Once Real Agents Are Calling?
There is now a measured number for this gap, though it needs its denominator attached.
MCP-Atlas is a benchmark of 1,000 human written tasks, spanning 36 real MCP servers and 220 tools, run against 20 frontier models from six providers. It reports that “63.3% of diagnosed failures are cognitive rather than tool-call related” (preprint, last revised 2026-05-19; harness released at github.com/scaleapi/mcp-atlas).
Read that carefully. It is a share of the failures its automated diagnostics classified in benchmark runs, not a share of all production MCP bugs. The same abstract is blunter about where those failures land: “several high-performing models fail after successful tool execution due to premature stopping or incorrect synthesis.”
Read it against what Inspector does. The cognitive share sits largely outside Inspector’s reach, because those failures happen in the model’s reading of a result that arrived perfectly. Inspector never misreads a result. It never reads one. The one lever it does give you on that side is the tool descriptions it renders, since an unclear description is a real cause of wrong-tool selection.
The tool-call share is not safely inside its reach either. Inspector confirms that a request you composed gets a correct response. It says nothing about the request your agent composed, which is where malformed arguments actually originate.
Nothing in an Inspector session evaluates whether the right tool was chosen for a user’s intent, or whether a description was clear enough for a model to choose well.
Two more classes follow from the remaining properties. One connection cannot produce lock contention, connection-pool exhaustion, or per-caller rate-limit interaction, so none of them can surface in a session that opens exactly one. (Be precise about the boundary here: instance-affinity and timeout-cascade bugs need many requests, not many callers, and a single Inspector session against a load-balanced deployment can absolutely hit them.) Nor can one connection to one server produce a tool-name collision between two servers a real client has mounted side by side.
Credentials are subtler, and worth stating precisely rather than as a blanket claim. Inspector 2.0.0 has real OAuth machinery, so it is not true that it always starts clean: its repository README describes core/auth/ as “OAuth: providers, discovery, storage, mid-session recovery (browser/node/remote backends)” and core/storage/ as “File I/O helpers for the OAuth persist backends”. What the README documents is mid-session recovery and persist backends; it does not state that tokens survive across separate sessions, so do not assume that either way.
What it cannot do is run your client’s refresh logic. An expired token that your agent framework surfaces as a generic tool error, instead of triggering the refresh you assumed it would, is a property of that client. Inspector is a different one.
What Does Inspector Not Tell You About the Tool List?
Two costs ride on the tool list, and Inspector renders that list without evaluating either.
The first is context. A client turns the server’s advertised tool list into tool definitions in the model’s request, so a verbose list spends budget on every turn, whether or not any tool gets called. Prompt caching softens that rather than removing it, since the definitions still sit in every request whether or not they are billed at full rate.
Inspector shows you the list and it shows you responses. Neither view is where that cost lands, which is why the accounting usually has to happen at an MCP gateway instead.
The second is trust. OWASP locates the root cause of MCP tool poisoning precisely: “The root cause is a trust gap between connect-time and runtime. Tool descriptions are reviewed once, when the agent first connects to a server. Tool responses go straight into the LLM context with no equivalent check.”
That gap is exactly where Inspector sits. It shows you one response, once, for a call you composed deliberately. It keeps no baseline to diff against, and the response it renders for you is not the response your agent will receive next week.
OWASP names the conditions that make this exploitable. One is that “Internal and external tools share the same privilege level within the agent.” Another is that system prompt restrictions “are enforced only by the LLM’s instruction-following, not by backend access controls.”
Which makes this a validation problem at the call boundary, not a looking-at-a-UI problem. Our guide to evaluating MCP server security covers the wider checklist.
How Do You Trace What Your Agent Actually Sent?
The through line in every gap above is the fourth property: Inspector connects as its own client. Closing the gap means getting into the path your agent actually uses.
Four moves, roughly in order of payoff.
Get into the real request path. Either an interception proxy that your client points at instead of the server, or instrumentation on both ends. Sitting beside the path is not the same as sitting in it.
A proxy is the cheaper of the two and captures raw JSON-RPC frames. Unless your client already propagates trace context, it will not tell you which agent turn produced them.
Instrument both ends. The OpenTelemetry semantic conventions for MCP are explicit that instrumentations “SHOULD propagate context … by injecting it into the MCP request params._meta property bag”, and that the receiver “extracts the context from params._meta and uses it as the remote parent.”
Done properly, “the MCP client span becomes a parent of the MCP server span regardless of transport used.” Instrument one side only and you get two disconnected traces and the appearance of observability. Our OpenTelemetry setup guide covers the wider pipeline.
Use the real attribute names. In that same document, mcp.method.name is the only Required attribute on the MCP spans. Among the conditionally required ones are error.type, gen_ai.tool.name, jsonrpc.request.id, mcp.resource.uri, and rpc.response.status_code.
mcp.session.id is only recommended, which is worth knowing before you build a correlation strategy on it.
Those conventions carry a Development status as of 2026-07-31, and they moved out of the main semantic-conventions repository, which now carries only a redirect stub, so pin your expectations accordingly.
Diff schemas in CI, using the canonicalised baseline from earlier, and fail the build on renames and type changes.
The protocol now makes the first two possible by design. The specification reserves the keys traceparent, tracestate, and baggage inside _meta for OpenTelemetry trace context, as an explicit exception to its own naming rules, and requires their values to follow W3C Trace Context and W3C Baggage respectively.
That reservation matters more than it reads. MCP is a stateless protocol, and the same page is direct that “an open connection, such as a STDIO process, is not a conversation or session”.
Correlating a tool call to the agent turn that made it is therefore a telemetry job, not something the protocol hands you. If the transport and primitive model underneath this is unfamiliar, start with what an MCP server actually is.
Is Inspector Plus Server Logs Enough?
The strongest objection to all of this is that it is overkill. Inspector plus structured stderr logging catches most bugs, costs nothing, and takes an afternoon. Adding distributed tracing to both sides of an MCP boundary is real work for a payoff most teams will not feel.
For a single stdio server called by one developer, that objection is correct, and the official guidance agrees with it. Use Inspector, log to stderr, move on.
Note the word stderr in that sentence, because on stdio the choice is not stylistic. The debugging guide states that “local MCP servers should not log messages to stdout (standard out), as this will interfere with protocol operation.” Stdout is the JSON-RPC channel on that transport, so a stray print() or console.log does not merely add noise, it injects a non-protocol line into the message stream and the client fails to parse it. The symptom, a server that works until someone adds a debug line, is common enough to be worth stating plainly.
It is worth noting how far the official guidance has already moved, though. The same debugging guide now records that logging “over the protocol (notifications/message) is deprecated as of protocol version 2026-07-28”, and lists server logging as “structured logs to stderr (stdio transport) or via OpenTelemetry (all transports)”. The protocol’s own answer to logging is now OpenTelemetry, on every transport.
The stderr objection stops being correct at two specific moments. The first is when your server moves to Streamable HTTP. The debugging guide is unambiguous: “For servers using the Streamable HTTP transport, stderr is not captured by the client. Use your own server-side log aggregation or OpenTelemetry for logs, and standard HTTP tooling (curl, browser DevTools Network panel) to inspect requests and SSE streams.”
Note that the guide keeps a cheap option on the table there. Curl and a Network panel will show you the frames. What they will not do is join a frame to the agent turn that produced it, which is the whole reason the trace-context reservation exists.
The second moment is when the caller stops being you. Logs record what your server did. They cannot record what the agent believed it was sending, or what the model concluded from the reply. The first of those is a tool-call failure your logs see only one side of; the second is what MCP-Atlas puts on the cognitive side of its split.
A third moment, narrower, is when a second caller appears at the same time, which server logs will record faithfully and in an order nobody can reconstruct. The same problem shows up one level up in multi-agent systems, for the same reason.
So the honest position is not that Inspector is insufficient. It is that Inspector answers request-shaped questions, and once you have agents rather than developers calling your server, most of your questions stop being request-shaped.
Where Does FutureAGI Fit?
We run an MCP server ourselves, so every row in that table is our problem too.
For the tracing half, traceAI-mcp is the piece that closes the gap in the previous section. It is OpenTelemetry instrumentation for MCP, and it is designed to be paired with the instrumentor for whichever framework is driving the calls, which is the part that matters here.
Install both, because the framework instrumentor ships as its own package (latest versions as of 2026-07-31):
pip install traceAI-mcp==0.1.2 traceAI-openai-agents==0.1.6import os
from traceai_mcp import MCPInstrumentor
from traceai_openai_agents import OpenAIAgentsInstrumentor
from fi_instrumentation import register
from fi_instrumentation.fi_types import ProjectType
os.environ["FI_API_KEY"] = "<your-api-key>"
os.environ["FI_SECRET_KEY"] = "<your-secret-key>"
trace_provider = register(
project_type=ProjectType.OBSERVE,
project_name="mcp_project",
)
OpenAIAgentsInstrumentor().instrument(tracer_provider=trace_provider)
MCPInstrumentor().instrument(tracer_provider=trace_provider)Instrumenting the agent framework and MCP together is the point, for the reason given in the previous section. The screenshot below is a trace captured this way, and it is easier to read than the argument for it.
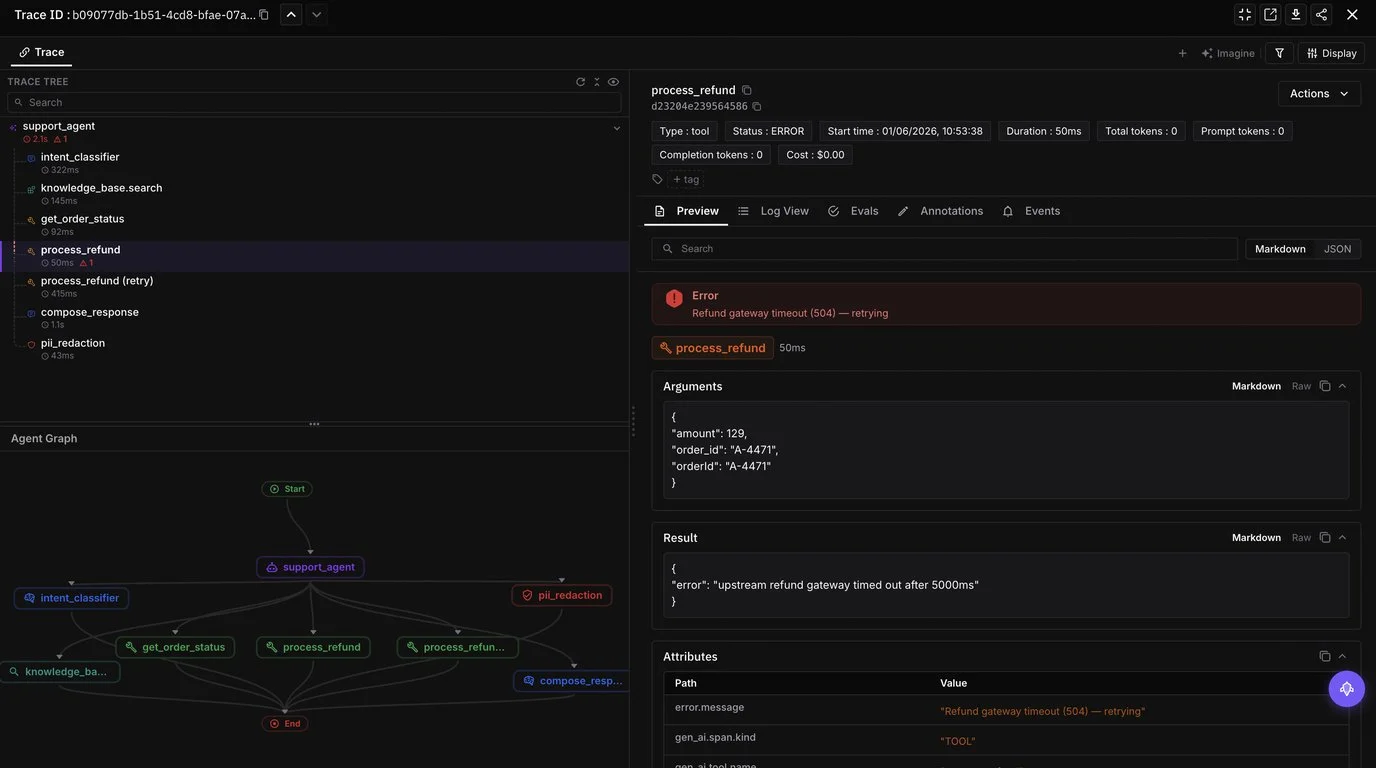
The span above is a process_refund call in a demo project, failing on a 504 from the refund gateway and retrying beneath it. The timeout is not the interesting part; a log line would have caught that.
Two other things are. The span sits inside the support_agent turn that produced it, between the tool calls either side of it, which is the correlation the protocol does not hand you. And the arguments carry the same order under two names, order_id and orderId, both set to A-4471, a caller hedging across a parameter rename by sending both spellings. It works against a permissive server and breaks the moment the server turns strict, which is exactly the kind of quiet compatibility shim nobody goes looking for.
It is visible because the arguments actually sent are attached to the span. In Inspector you would have typed those arguments yourself, so there would have been nothing to catch.
(The credentials above are instrumentation keys. Our own hosted MCP server at https://api.futureagi.com/mcp is a separate surface with its own auth, documented as happening “automatically via OAuth 2.0” with “no API keys needed”.)
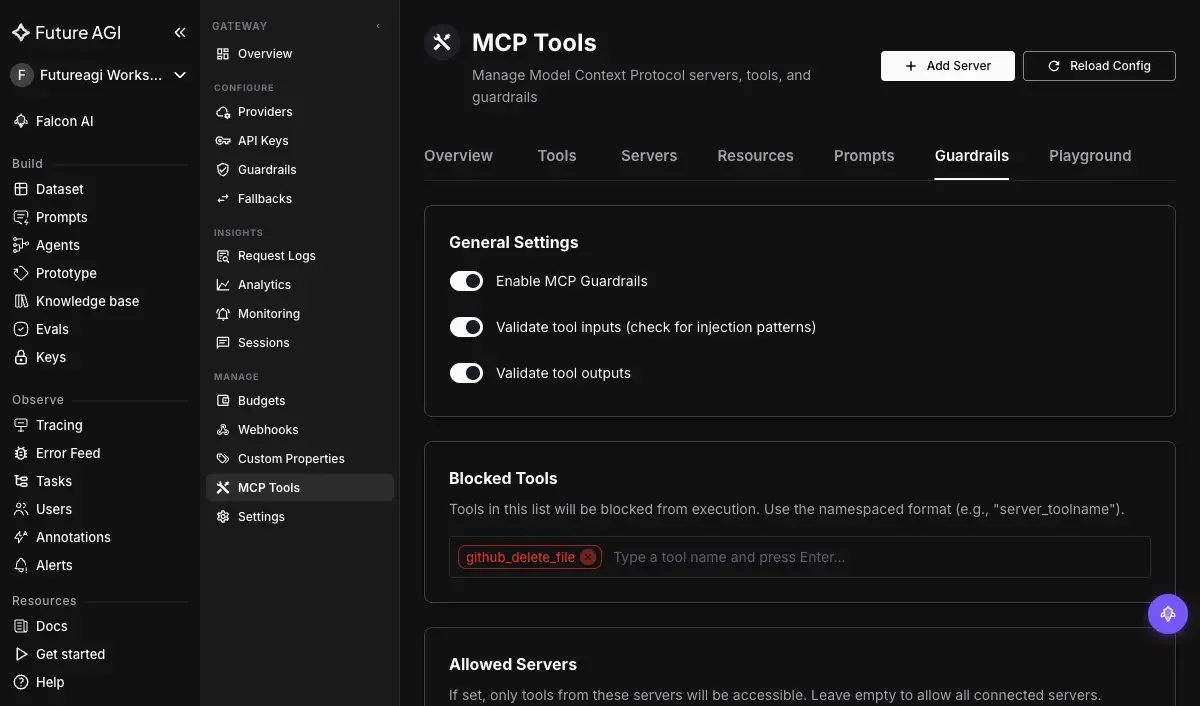
For the enforcement half, the Agent Command Center documents a set of built-in guardrail types, three of which sit where this post says validation belongs. MCP Security “validates MCP protocol security”, Tool Permissions “validates tool/function call permissions”, and Input Validation “validates input format and structure”.
All three are listed at the Pre stage, meaning they run before the request reaches the model rather than after you go looking in a UI. Verified against the docs on 2026-07-31.
The gateway exposes the MCP-specific half of that as its own surface, under its own labels, with input and output validation toggles, a blocked-tool list, and an allowed-server list:
Where the Inspector Boundary Actually Sits
Inspector answers one question well: does this server respond correctly to a request you compose by hand, on one connection, from a client that is not the one you will ship.
Keep using it for that. It is the right first stop, its CLI belongs in CI, and its protocolEra switch is genuinely useful while both protocol eras are in play.
One caution that follows from the same boundary, and which the gaps above might otherwise be read as encouraging. “Get closer to production” is not an argument for pointing Inspector at production. It authenticates as itself, invokes tools for real, and its transport runs on a local port; a tool call you fire by hand is a write against whatever data sits behind it. The instrumentation route in the previous section is the one that belongs in production, precisely because it observes the path instead of adding a second caller to it.
The boundary is the four properties, not a feature gap. Local, interactive, single connection, its own client. Anything that depends on who called, what they actually sent, how many of them there were, or how the model read the reply is on the far side of it, and it is a boundary the tool’s current shape cannot cross. A capture mode sitting between a real client and your server would move three of the four at once, but that would be a different tool, not a bigger Inspector.
Start with Inspector. Then get into the real request path, instrument both ends so your traces join, and diff your schemas in CI.
Frequently Asked Questions About MCP Inspector
What Is MCP Inspector Used For?
MCP Inspector is an interactive developer tool for testing and debugging MCP servers. It lists the tools, resources, and prompts a server exposes, renders their schemas, and lets you invoke any of them with arguments you type. Version 2.0.0 ships a web UI, a scriptable CLI, and a terminal UI over one shared core, and the official debugging guide says it should be your first stop.
Why Does a Tool Work in MCP Inspector but Fail With My Agent?
Because Inspector builds its input form from the schema the server advertises at that moment, so what you send always matches what the server expects. Your agent may be holding a tool definition captured earlier. If a parameter was renamed, a permissive server can ignore the unknown field, apply a default, and return an empty but valid result. Inspector cannot reproduce this, because it never holds a stale definition.
Does MCP Inspector Show What My Agent Actually Sent?
No. Inspector connects to your server as its own client, so it shows the requests Inspector composes, not the requests your agent composes. Capturing real traffic needs something in the data path: either a proxy between client and server, or OpenTelemetry instrumentation on both sides that stitches the two halves into one trace rather than two.
What Should You Use Alongside MCP Inspector in Production?
Instrumentation in the real request path, OpenTelemetry spans on both client and server so traces join instead of fragmenting, a schema baseline captured at connect time and structurally diffed in CI, strict argument validators so unknown parameters fail loudly rather than defaulting, and load tests that exercise more than one caller. Inspector stays useful for the interactive work it was built for.
Frequently Asked Questions
What is MCP Inspector used for?
Why does a tool work in MCP Inspector but fail with my agent?
Does MCP Inspector show what my agent actually sent?
What should you use alongside MCP Inspector in production?
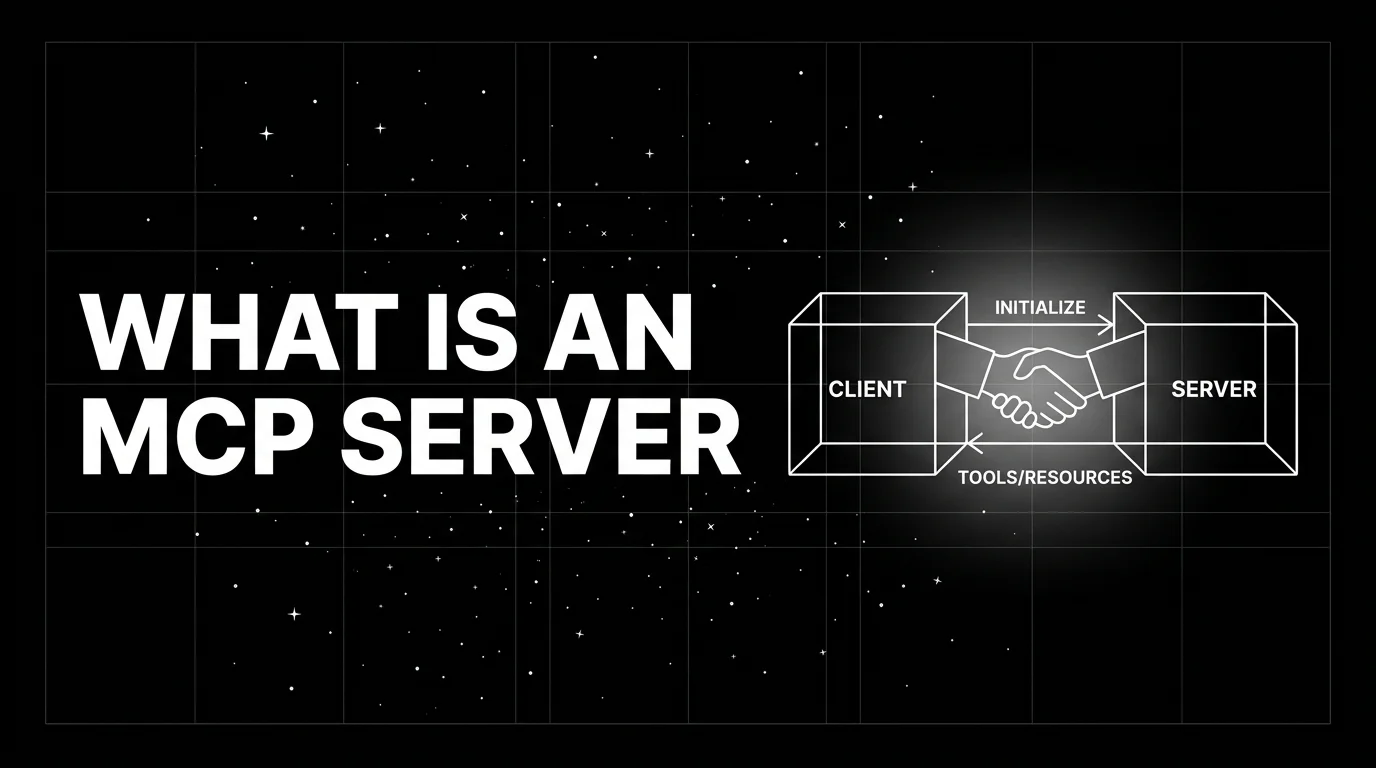
An MCP server exposes tools, resources, and prompts to LLM clients via Model Context Protocol. Architecture, transports (stdio, SSE, HTTP), lifecycle.

Evaluate MCP servers for security in 2026: tool-description injection, tool-result tampering, sandbox escape, cross-tenant isolation. Four eval checks.

Trace, debug, evaluate multi-agent AI systems 2026 with traceAI, OpenTelemetry spans, rubric scoring. Code, span tree, three real failure cases.