Brier Score: Formula, Decomposition, and When It Misleads
The Brier score formula with a worked example, the reliability and resolution decomposition, and when a good score still tells you nothing.
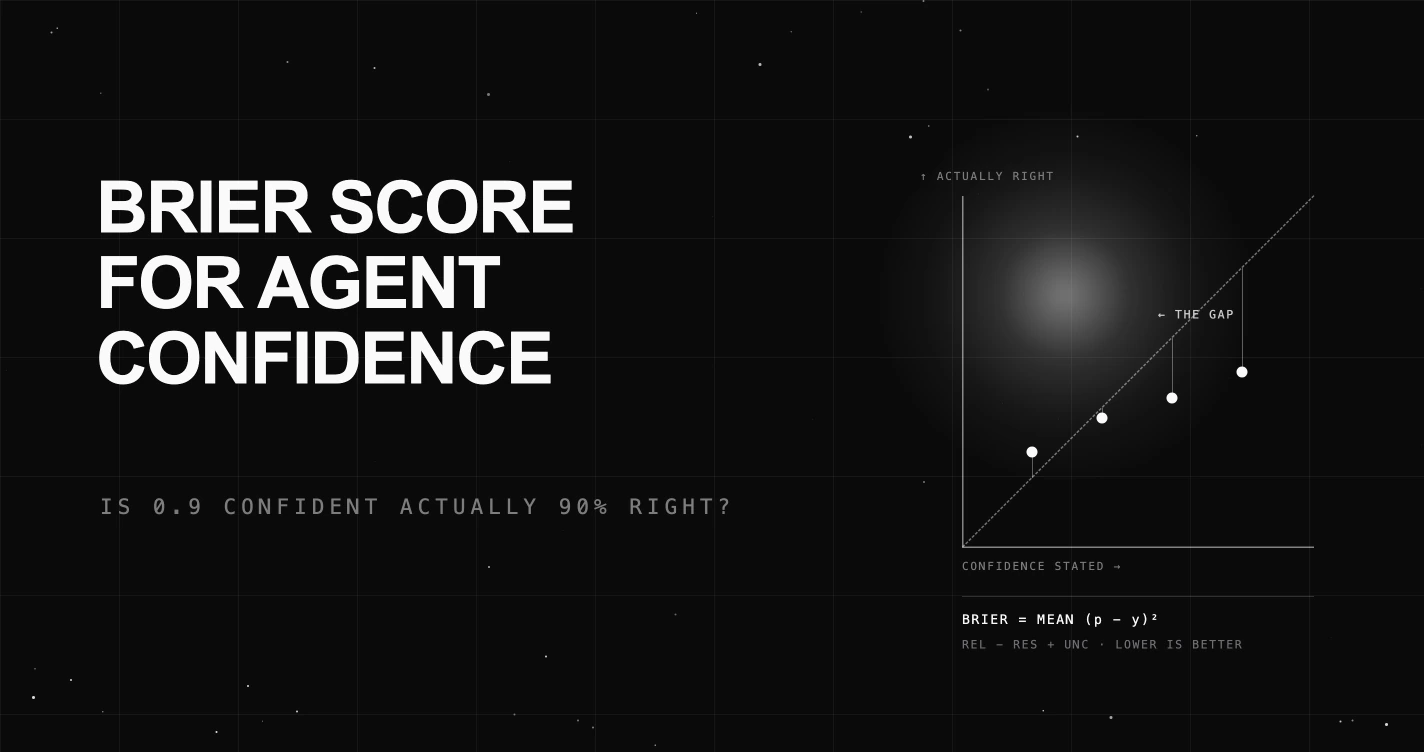
Table of Contents
An agent answers a question with 0.9 confidence and gets it wrong. On the next question it answers 0.9 again and gets it right.
Accuracy cannot tell those two runs apart. Neither can the average confidence, which is 0.9 in both cases. If you are routing on that number, escalating anything below 0.7 to a human, you need to know whether 0.9 means anything at all.
The Brier score is the standard way to answer that. It has been the standard since 1950, it is cheap to compute, and it is routinely misread.
What Is the Brier Score?
The Brier score is the mean squared difference between a predicted probability and the outcome it predicted. Teams use it to check whether a confidence number is trustworthy before wiring a decision to it. Lower is better.
One qualifier belongs here rather than in a footnote. A score of 0 requires predicting 1 on every item that happened and 0 on every item that did not. Where outcomes are genuinely uncertain, the best possible forecaster does not reach 0 and should not try to.
Hoessly’s 2025 review of misconceptions about the Brier score lists “a Brier score of 0 means a perfect model, and a perfect model has Brier score 0” as misconception number one.
On an agent where every question in a class genuinely carries a 0.7 chance of success, a perfectly calibrated signal scores about 0.21. That is the target, not a failure. Where difficulty varies within the class, a calibrated signal scores lower, because its confidence can then separate the easy items from the hard ones.
It comes from weather forecasting. Glenn Brier proposed it in Monthly Weather Review in 1950, and his own description of why it works still reads as the best argument for using it on agents:
“A little experience with the use of score P will soon convince him that he is fooling nobody but himself if he thinks he can beat the verification system by putting down only zeros and unities when his forecasting skill does not justify such statements of extreme confidence.”
That property has a formal name. The Brier score is a strictly proper scoring rule, which scikit-learn states plainly in the brier_score_loss reference. Because the score is a loss, a forecaster minimises their expected score only by reporting what they actually believe. Bluffing confidence and hedging both lose.
One note on ranges. Brier’s original score summed error across every category, which puts its worst possible value at 2 rather than 1. Modern binary implementations count only the positive class, halving the range to 0 through 1.
Scikit-learn keeps both. Its scale_by_half argument rescales to 0 through 1 “only for binary classification (as customary)”, and keeps the original 0 to 2 range for multiclass.
Being strictly proper is also why the metric is no longer only a read-out. Recent work trains on it: Damani and colleagues add a Brier term to a binary correctness reward to make a model’s stated confidence track its own accuracy.
Separately, ConfidenceBench (preprint, July 2026) benchmarks frontier models under a shared verbalized-confidence and Brier framing.
Measuring the score and optimising against it are different jobs. This post is about the first, and about the metric rather than the signal feeding it.
How to obtain a calibrated confidence signal in the first place is covered in our guide to evaluating LLM confidence and uncertainty. Logprob aggregation, the reliability diagram, the ECE production target, Platt scaling, isotonic regression, and the runtime uncertainty gate are that post’s territory and are not re-explained here.
How Do You Calculate the Brier Score?
For binary outcomes the formula is:
BS = (1/N) * Σ (p_i - y_i)²

  p_i = predicted probability
  y_i = 1 if the event happened, 0 if it did not
Take ten agent answers, each with a stated confidence and a known outcome.
| Confidence | Correct | (p - y)² |
|---|---|---|
| 0.95 | 1 | 0.0025 |
| 0.90 | 1 | 0.0100 |
| 0.85 | 1 | 0.0225 |
| 0.80 | 0 | 0.6400 |
| 0.70 | 1 | 0.0900 |
| 0.60 | 1 | 0.1600 |
| 0.55 | 0 | 0.3025 |
| 0.40 | 0 | 0.1600 |
| 0.30 | 1 | 0.4900 |
| 0.20 | 0 | 0.0400 |
The squared errors sum to 1.9175, so the Brier score is 0.1918.
Notice which rows dominate. The 0.80 that was wrong contributes 0.64, and the 0.30 that was right contributes 0.49. Together those two rows are 59% of the total. Confident mistakes are what the metric is built to find.
Now hold accuracy fixed at 70% and vary only the confidence habit:
| Agent behaviour | Accuracy | Brier |
|---|---|---|
| Calibrated, commits when sure (0.9, 0.9, 0.8, 0.8, 0.7, 0.7, 0.6 on the seven it gets right; 0.3, 0.2, 0.2 on the three it gets wrong) | 70% | 0.0610 |
| Always answers 1.0 | 70% | 0.3000 |
| Always answers 0.5 | 70% | 0.2500 |
Three agents, identical accuracy, scores differing by a factor of five. The hedger who always says 0.5 is never badly wrong on any single item and never useful either. The score reflects that.
What Do the Three Parts of a Brier Score Tell You?
A single Brier number is a bundle, and this is where the misreading starts. Scikit-learn’s calibration guide puts the warning bluntly:
“A lower Brier loss, for instance, does not necessarily mean a better calibrated model, it could also mean a worse calibrated model with much more discriminatory power, e.g. using many more features.”
Allan Murphy solved this in 1973 in the Journal of Applied Meteorology, splitting the score into three terms: reliability, resolution, and uncertainty. The identity is:
Brier = Reliability - Resolution + Uncertainty

  Reliability  gap between stated confidence and observed accuracy   (lower is better)
  Resolution   how much the agent's confidence varies with outcome   (higher is better)
  Uncertainty  base rate property of the data, ȳ(1 - ȳ)              (not yours to change)
Run it on two agents with identical 70% accuracy. The first is deliberately idealised, answering 0.9 on exactly the questions it gets right and 0.1 on exactly the ones it gets wrong, which no real agent achieves. It is there to show what the terms do at the limit:
| Agent | Brier | Reliability | Resolution | Uncertainty |
|---|---|---|---|---|
| Confident when right, doubtful when wrong | 0.0100 | 0.0100 | 0.2100 | 0.2100 |
| Answers 0.7 to everything | 0.2100 | 0.0000 | 0.0000 | 0.2100 |
Note which agent wins on which term. The second is the better calibrated of the two. Its stated 0.7 matches its observed 70% exactly, so its reliability is zero, the best possible value, while the first carries a 0.01 penalty for stating 0.9 and 0.1 where the observed frequencies were 1 and 0.
The second is also useless, because its confidence never varies, so its resolution is zero. Better calibration, worse score, no information.
That is the reason to compute the split rather than the score alone. A headline Brier of 0.21 does not tell you whether you hold a miscalibrated agent or an uninformative one, and those need opposite fixes.
One caveat belongs with the method. Both agents above state a handful of distinct confidence values, and the three-term identity is exact only in that discrete case.
A real agent emits a continuous confidence, which you have to bin before the terms can be computed. Binned reliability and resolution then carry the same bias-variance choice this post criticises in ECE below, because within-bin spread deflates reliability and inflates resolution.
The identity itself also becomes approximate. Stephenson and colleagues showed in 2008 that a binned decomposition needs two extra within-bin components, which fold into a generalised resolution term less sensitive to bin width. Choose the binning deliberately, or use the binning-free calibration and refinement view.
Read the terms rather than the total for a second reason. A score near the uncertainty term does not by itself prove an agent is uninformative, which is misconception number four in the same review. The claim above survives it because resolution is measured at zero, not inferred from the total.
When Is the Brier Score the Right Metric?
Three situations where it is the right tool.
Comparing two agents on the same evaluation set. Uncertainty is identical for both, so any difference in Brier beyond sampling noise is a real difference in reliability or resolution. The score is itself an estimate: on sets below a few hundred items, bootstrap an interval before calling a small gap real.
Tracking calibration drift across releases. A prompt change that leaves accuracy flat while Brier climbs has made the agent more confidently wrong, which accuracy alone will never show you.
Auditing a confidence signal before you route on it. If a threshold sends work to humans, the threshold is only as good as the number underneath it.
When Does the Brier Score Mislead You?
Three ways, and the first is the one that catches teams out.
A high base rate flatters everything. Take an agent that is right 95 times out of 100 and always answers 0.95. Its Brier score is 0.0475, which looks excellent. Its resolution is 0.0000. The score is carrying no information about which individual answer to trust, which is the only thing you wanted it for.
Scores are not comparable across datasets. Because uncertainty is baked in, a 0.05 on an easy set and a 0.18 on a hard set say nothing about which agent is better calibrated. Compare on the same set, compare the decomposed terms, or use the skill score below.
It says nothing about which answers to decline. The Brier score is an aggregate over all predictions. It tells you the probabilities are trustworthy in aggregate. It does not identify the specific items worth escalating.
What Is the Brier Skill Score?
The second of those failures has a standard fix. The Brier skill score rescales the raw number against a baseline forecaster, usually one that ignores the input and predicts the base rate every time:
BSS = 1 - (BS / BS_reference)

  BS_reference = ȳ(1 - ȳ), the uncertainty term
Positive means you beat the baseline, 0 means you matched it, negative means you would have done better guessing the base rate.
Because the reference is exactly the uncertainty term, the skill score divides out the property of the data that made raw scores incomparable. The ten answers above score 0.1918 against a base rate of 0.6, giving a reference of 0.24 and a skill score of 0.201.
Now put the flattering agent from the previous section through it. It scores 0.0475, its base rate is 0.95, and its reference is also 0.0475. Its skill score is 0.0000, exactly zero, because predicting 0.95 on everything is precisely what the baseline does.
That is the same verdict the resolution term gave, reached from the other direction. Report the skill score when you need to compare across sets, and the decomposition when you need to know which half is broken.
How Does the Brier Score Compare to Log Loss and ECE?
Three metrics, three different blind spots.
| Brier score | Log loss | Expected calibration error | |
|---|---|---|---|
| What it measures | Squared error of probabilities | Negative log of the probability given to the truth | Weighted average gap between confidence and accuracy, per bin |
| Range | 0 to 1 (binary convention) | 0 to unbounded | 0 to 1 |
| Strictly proper | Yes | Yes | Not a scoring rule |
| Blind to | Which term of the decomposition moved | Which term of the decomposition moved, and one bad call can dominate | Errors that cancel inside a bin |
Log loss is the sharper instrument for catching confident errors, and the reason is structural. Gneiting and Raftery record that the logarithmic score “has been criticized for its unboundedness”, because the negative log of a probability diverges as that probability approaches zero.
One confident mistake can therefore dominate a log loss average in a way it cannot dominate a Brier average. Whether you want that depends on whether a single catastrophic call matters more to you than the overall pattern.
Expected calibration error is the easiest to read: bin the predictions and take the population-weighted average of the gap between each bin’s accuracy and its mean confidence. Guo and colleagues formalised its use for neural networks in 2017, crediting the measure to Naeini and colleagues in 2015.
Its weakness is the binning. Nixon and colleagues showed in 2019 that “metrics that depend on static binning schemes like ECE suffer from issues where you can get near 0 calibration error due to overconfident and underconfident predictions overlapping in the same bin.”
Bin count is a bias-variance choice, and adaptive binning is the more stable option.
Our glossary covers model calibration and the calibration curve if you want the visual reading of the same idea.
Can a Brier Score Give You a Deferral Threshold?
Not directly, and the distinction is the useful part.
A good Brier score does not hand you a threshold. It tells you the probabilities are trustworthy enough that a threshold would mean something. Setting a cut on an uncalibrated signal is arithmetic on noise, however carefully the number was chosen.
The decomposition decides whether a cut exists at all. An agent with good reliability and near-zero resolution cannot support one, because its confidence does not separate the answers it gets right from the ones it gets wrong. There is no cut point to find, at any value.
Where the cut goes once calibration holds is a cost decision rather than a statistical one, and the runtime gate that acts on it is covered in evaluating LLM confidence and uncertainty rather than here.
Where Does Future AGI Fit?
Being direct about the boundary: Future AGI does not ship a built-in Brier score, ECE, or reliability diagram eval today. If you want the metric, you build it as a custom or code eval. What the platform does provide is the layer underneath and the layer above.
Underneath, the statistical metrics family ships thirteen code-based evals as of August 2026, “each one runs a fixed formula over the output and expected values you supply and returns a normalized 0-1 score, no LLM judge involved”.
log_loss is among them, defined as “cross-entropy between predicted probabilities and true 0/1 labels, lower loss scores higher”. Read that second clause before comparing it to anything above. The platform normalises the metric to a 0 to 1 score where higher is better, the opposite orientation to the raw, unbounded log loss this post describes.
Brier is not in that family, but a Code Eval will run it: “deterministic logic runs in a sandbox (Python or JavaScript) and computes the result directly from the text.”
Above it sits the threshold machinery this post’s last section is about. In the output types and scoring reference, “whatever shape the value takes, every result resolves to an underlying score between 0 and 1”.
Every template then carries a pass threshold, documented as “a score at or above the threshold counts as a pass”, and defaulting to the midpoint, 0.5.
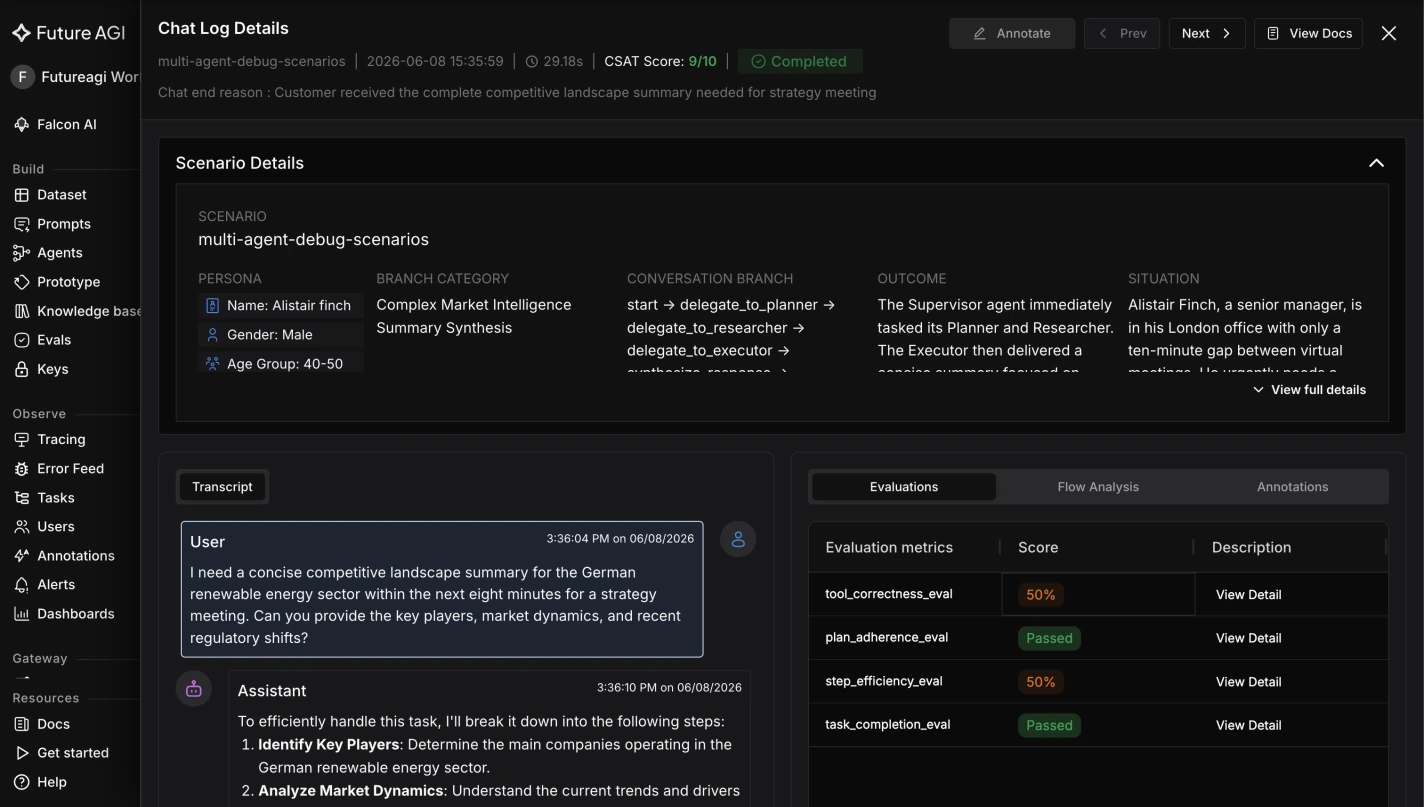
That threshold is where abstention becomes an action rather than a number. Annotation automation rules fire on conditions like eval_score < 0.5, and the documented example action is “auto-add to review queue”.
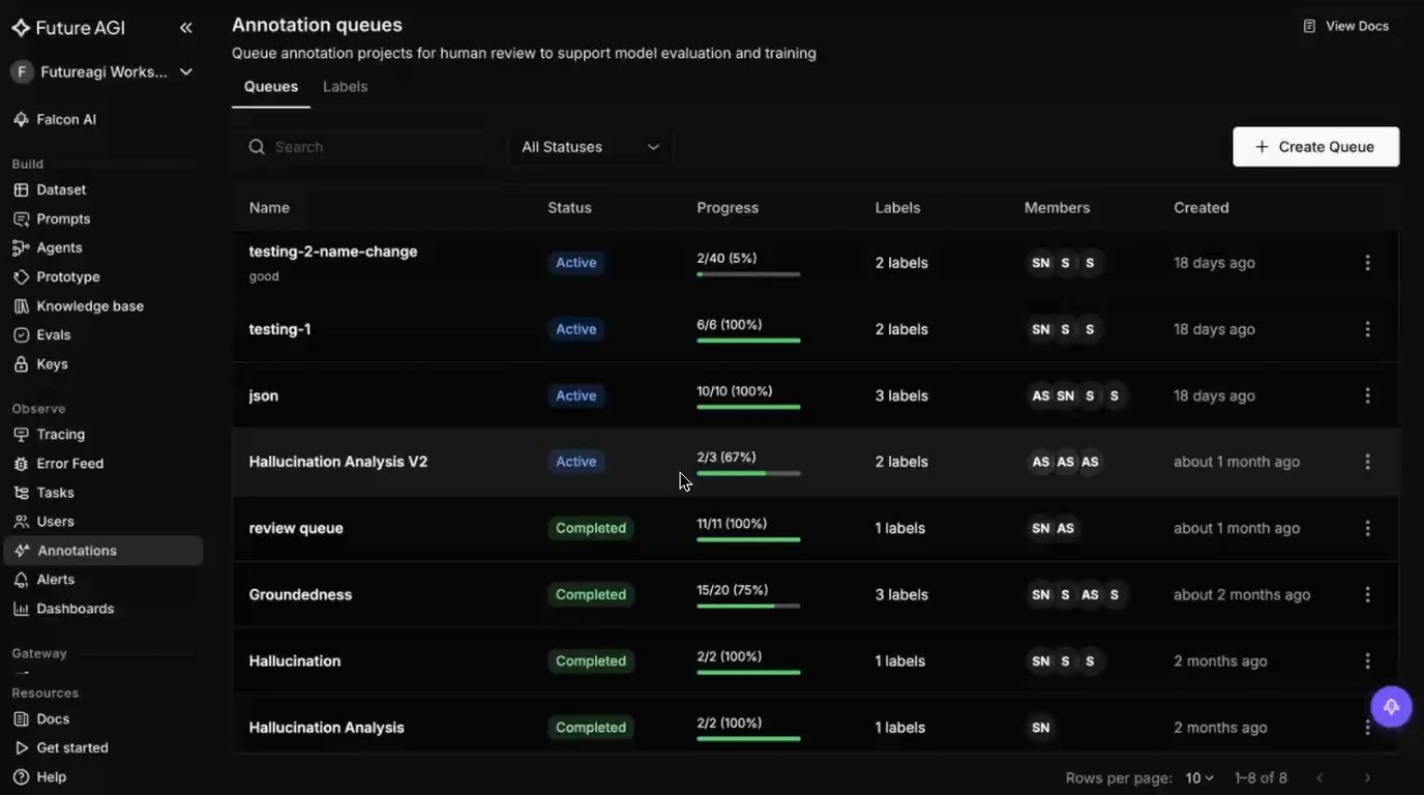
That is the deferral path a calibrated confidence score earns you: a measured cut, and somewhere for the declined work to go.
Which Confidence Failures Should You Measure First?
Compute the decomposition, not just the score. A Brier number on its own cannot distinguish an agent that is miscalibrated from one that is merely uninformative, and those need opposite fixes.
Check resolution before you trust a good score. On a high base rate task, a flat confidence value will score well and tell you nothing, which is the failure most likely to survive review.
Then set the threshold from cost, not from the metric. Calibration earns you the right to have a threshold. It does not tell you where to put it.
Frequently Asked Questions About the Brier Score
What Is the Brier Score Formula?
For binary outcomes it is the mean of (p minus y) squared, where p is the predicted probability and y is 1 if the event happened and 0 otherwise. The modern binary convention gives a score between 0 and 1, and lower is better.
A 0.8 on an event costs 0.04. The same 0.8 on a non-event costs 0.64.
Is a Lower Brier Score Always Better Calibrated?
No, and this is the most common misreading. Scikit-learn’s calibration guide states it directly: a lower Brier loss does not necessarily mean a better calibrated model, it could also mean a worse calibrated model with much more discriminatory power. The score bundles calibration, informativeness, and the base rate into one number.
What Is the Difference Between the Brier Score and Log Loss?
Both are strictly proper scoring rules over predicted probabilities. The Brier score is squared error, so each prediction contributes at most 1 and the average is bounded. Log loss diverges as the predicted probability approaches zero, so it is unbounded, and one confidently wrong prediction can dominate the average.
Can an Agent Get a Good Brier Score Without Being Useful?
Yes, in two ways. On a task it gets right 95 percent of the time, always answering 0.95 scores about 0.0475 while carrying no information about which answer to trust. Separately, an agent answering 0.5 to everything is never badly wrong on any item. Both look acceptable and both have zero resolution.
How Do You Set an Abstention Threshold From a Brier Score?
You do not, directly. A good Brier score tells you the probabilities are trustworthy enough to act on, which is what makes a threshold meaningful. Where to put the cut is a cost decision: what a wrong answer costs against how much review capacity you have. Measure calibration first, then choose the cut.
Frequently Asked Questions
What is the Brier score formula?
Is a lower Brier score always better calibrated?
What is the difference between the Brier score and log loss?
Can an agent get a good Brier score without being useful?
How do you set an abstention threshold from a Brier score?
Logprob aggregation, semantic entropy, Brier score, and Platt scaling. The 2026 methodology for calibrated LLM confidence scores you can actually trust.

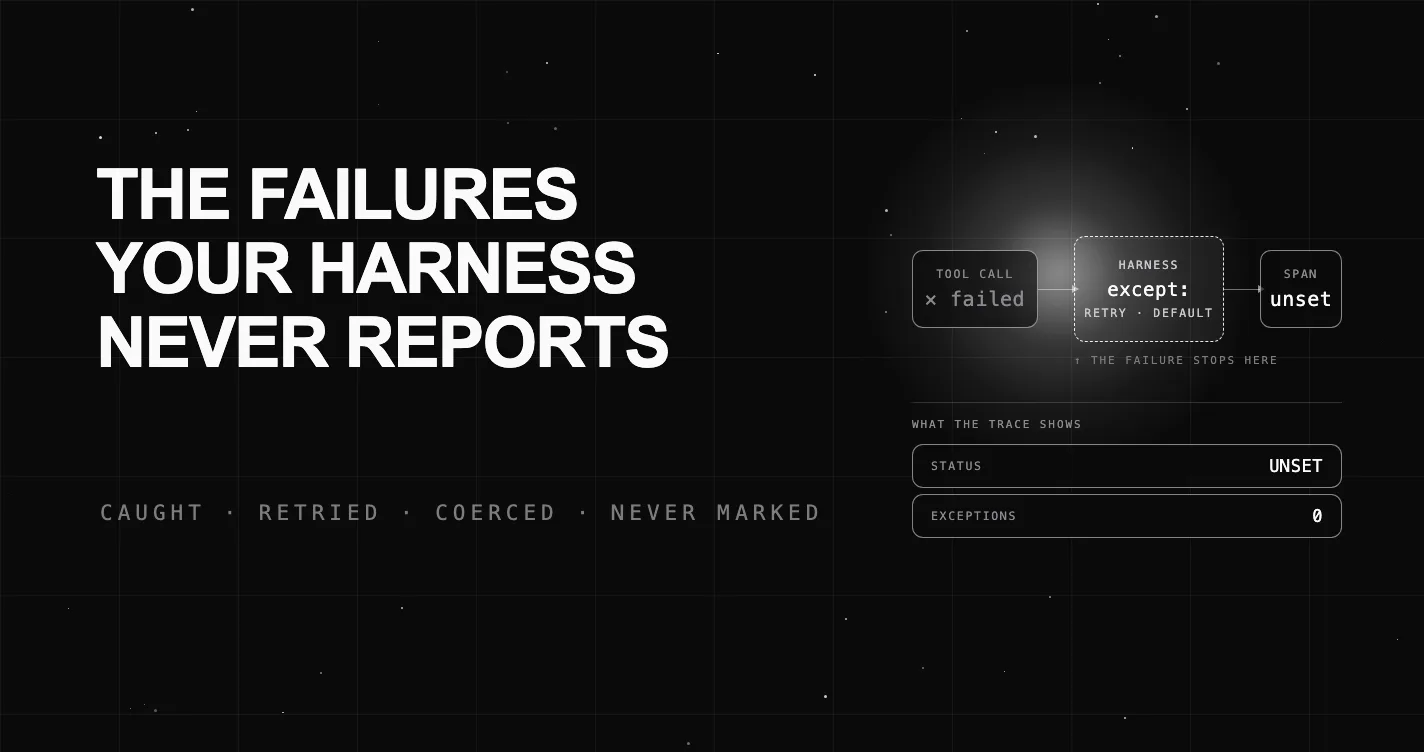
Agent harnesses catch errors to keep a run alive, so failed steps leave an Unset span that trace UIs render as green. Here is how to surface them.

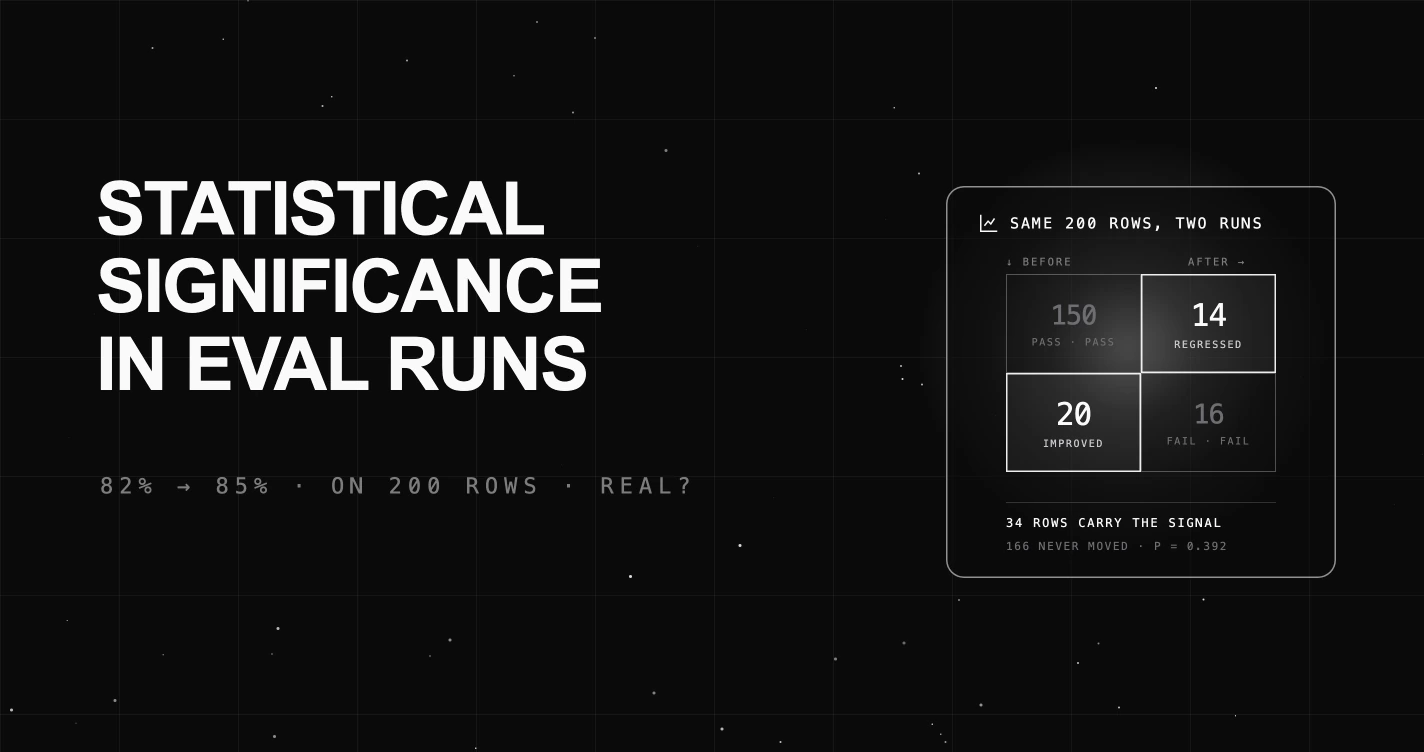
How to calculate statistical significance in an LLM eval run, which test fits pass/fail, category, and score evals, and what your eval set can detect.