What Tau-Bench Actually Measures
Tau-bench grades agents on database state after a conversation with a simulated user. What pass^k means, and what the published curves say that the mean does not.
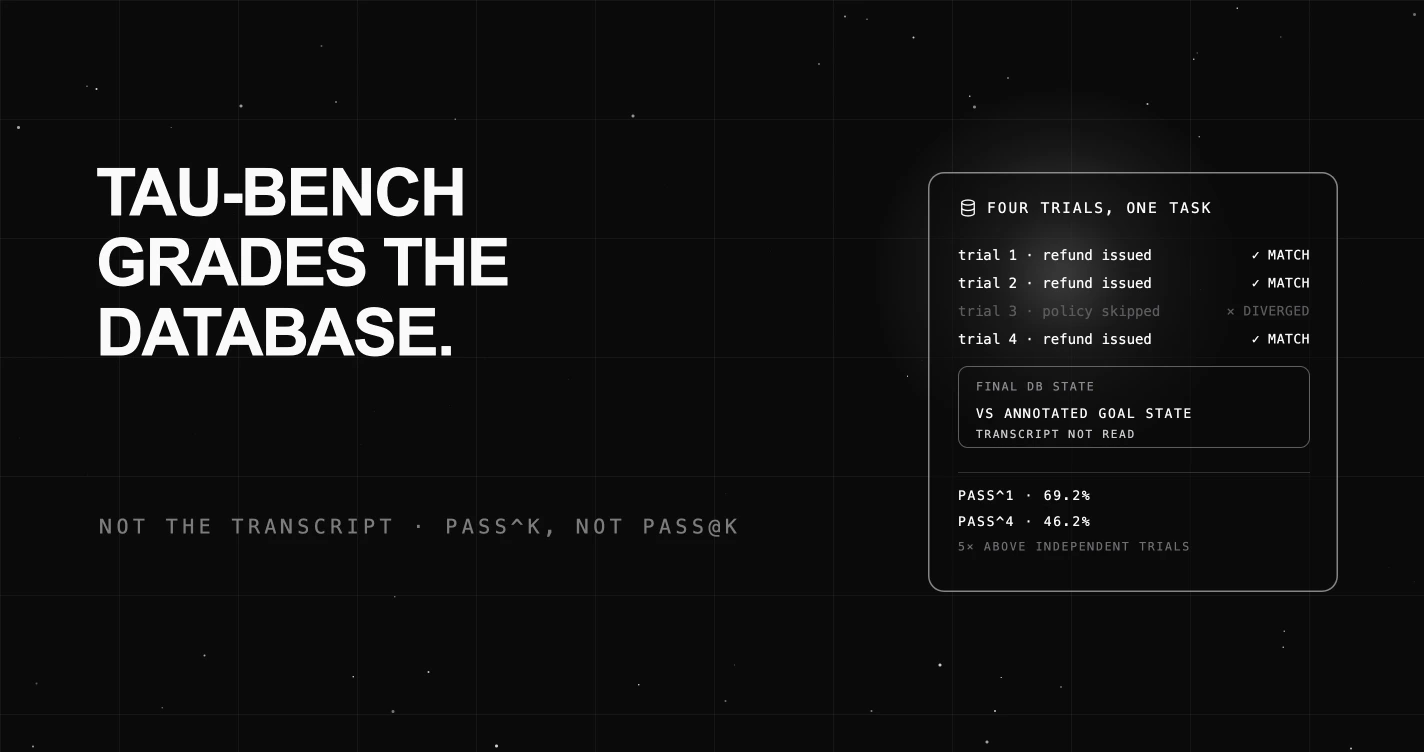
Table of Contents
Tau-bench is a benchmark for customer service agents that does something most conversational evaluations do not: it ignores the transcript.
An agent talks to a simulated customer, calls tools, and eventually stops. The grade comes from comparing the database afterwards against an annotated goal state. Fluency counts for nothing. Either the refund was issued or it was not.
The short version: tau-bench grades actions rather than words, scores reliability with pass^k rather than a single success rate, and its published curves say something the headline number hides.
What Does Tau-Bench Actually Test?
Whether an agent can follow rules while talking to someone.
The paper opens by naming the gap it was built for:
“Existing benchmarks do not test language agents on their interaction with human users or ability to follow domain-specific rules, both of which are vital for deploying them in real world applications.”
Those are two separate capabilities, and both are missing from static benchmarks. An agent evaluated on a fixed prompt never has to ask a clarifying question. An agent evaluated on task completion alone is never penalised for getting there by breaking a rule it was told to follow.
The benchmark comes from Sierra, and its original implementation covers two domains, airline and retail. In each, the agent receives domain-specific API tools and policy guidelines.
The guidelines are the interesting half. They create a category of failure that pure task benchmarks cannot express: succeeding at what the customer asked, in a way the business does not permit.
Then there is the grading, which is the design decision worth borrowing. The paper describes an evaluation process that “compares the database state at the end of a conversation with the annotated goal state”.
Consider what that rules out. An agent that is warm, articulate, and confident, that says it has processed the exchange and never calls the tool, scores zero. There is no partial credit for sounding correct, because the transcript is not what is being read.
Two adjacent subjects are covered elsewhere and not repeated here. Whether a benchmark score should gate a production release is argued in LLM benchmarks versus production evals and in agent observability versus evaluation versus benchmarking.
Who Plays the User?
Another language model, and this deserves more attention than it usually gets.
The abstract states the user is “simulated by language models”. The repository is specific about the default: “By default, we use gpt-4o as the user simulator with strategy llm”. Other strategies ship alongside it, including react, verify and reflection, and the user model is swappable with a --user-model flag.
That design is what makes the benchmark runnable at all. Human users would make it unrepeatable and unaffordable, and repeated trials are the whole basis of its headline metric.
It also means the simulator is part of the measurement apparatus rather than part of the environment. A more capable user model asks better clarifying questions and supplies missing details more readily, which flatters the agent under test. A more stubborn one does the opposite.
So a tau-bench score is a statement about a pairing, not about an agent alone. When comparing numbers from different sources, the user simulator is the first thing to check and the most commonly unstated.
Building your own simulated users, with personas and adversarial pressure rather than a single cooperative default, is covered in simulated multi-turn conversation eval.
What Is pass^k, and Why Not pass@k?
Because the familiar metric answers the wrong question for this domain.
pass@k is the probability that at least one of k attempts succeeds. It fits code generation, where you can generate ten candidates, run the tests, and ship whichever passes. Extra attempts are free upside.
pass^k, said aloud as “pass-hat-k” after the caret in the notation, is the probability that all k attempts succeed, averaged across tasks. Tau-bench introduced it to “evaluate the reliability of agent behavior over multiple trials”.
The inversion follows from the setting. A support agent does not get ten attempts at one customer. It gets one attempt each at ten customers, and it cannot check its own work, because there is no test suite for whether a refund policy was applied correctly.
Under those conditions, the question is not whether the agent can succeed. It is how often it fails, and pass^k is built to make that visible.
The paper’s own summary of what it found is blunt. Even “state-of-the-art function calling agents (like gpt-4o) succeed on <50% of the tasks”, and are “quite inconsistent (pass^8 <25% in retail)”. Both figures describe the models of mid-2024, not today’s.
Which Version of Tau-Bench Are You Reading?
Almost certainly not the current one, and this trips up most citations of the benchmark.
The 2024 repository now opens with a warning that “the tasks in this repo are not updated”, and directs readers to the successor for “the latest fixed tasks and new domains”. Three versions exist.
| Version | Added |
|---|---|
| tau-bench (2024) | airline and retail, state grading, pass^k |
| tau-2-bench (2025) | dual control, where the user also holds tools, plus a telecom domain |
| tau-3-bench (2026) | banking knowledge retrieval, full-duplex voice, and more than 75 task fixes |
That last entry matters for anyone quoting scores. The task fixes “removed incorrect expected actions, clarified ambiguous instructions, fixed impossible constraints, and added missing fallback behaviors”, which means some share of the original failures were the benchmark’s rather than the agent’s.
The mechanism is what survives all three versions, and it is what this post is about. The numbers do not survive, so treat every figure below as a historical measurement of a specific artifact.
What Do the Published Numbers Say?
More than the mean does, if you read the shape rather than the value.
Below are the original repository leaderboard figures for claude-3-5-sonnet-20241022 under the tool-calling strategy, verified 2026-08-01. The repo publishes other strategies for the same model with different results, so the strategy label is part of the number.
| Domain | pass^1 | pass^2 | pass^3 | pass^4 |
|---|---|---|---|---|
| airline | 46.0% | 32.6% | 26.3% | 22.5% |
| retail | 69.2% | 57.6% | 50.9% | 46.2% |
The usual reading stops here: scores decline with more trials, agents are inconsistent, reliability is hard. All true, and all visible in the abstract already.
The more interesting question is how fast the decline should have been. If every task were equally hard, with success probability p on each independent trial, then pass^k would simply be p^k. That is a null model the definition invites, and it is easy to check.
| Domain | pass^4 published | p^4 if uniform | Ratio |
|---|---|---|---|
| airline | 22.5% | 4.5% | 5.0x |
| retail | 46.2% | 22.9% | 2.0x |
Both domains land far above the null. Airline’s pass^4 is five times what uniform independent trials would produce.
That gap has one straightforward explanation. Failure is concentrated, not spread. A benchmark where every task was a 46% coin flip would collapse to 4.5% by the fourth trial. One where a chunk of tasks are solved almost every time, and another chunk fail almost every time, decays much more slowly, because the reliable group keeps passing.
Fitting the simplest mixture that reproduces these curves puts roughly 23% of airline tasks and 45% of retail tasks in the essentially-always-succeeds group, with the remainder performing considerably worse than the headline implies.
The method, so you can check it: assume a fraction f of tasks succeed with probability near 1 and the rest succeed at rate q, giving pass^k = f + (1-f)q^k, then fit f and q to all four published points by least squares. Fitting only pass^1 and pass^4 instead moves the estimates by one to two points, which is a fair measure of how much precision to read into them.
Treat that fit as illustrative rather than measured. It is a crude two-group model, it is not the only curve that fits, and the underlying trials are not strictly independent.
That last caveat deserves more than a mention, because it admits a competing explanation. Under the benchmark’s own independent-trials framing, a pass^4 far above p^4 does imply that difficulty varies across tasks.
But correlation between repeated trials of the same task, from a shared simulator, fixed policy text, and identical scaffolding, lifts pass^4 above p^4 too, with no spread in difficulty at all. The published aggregates cannot separate the two. Per-task outcome counts could, and the repository does not publish them.
What is safe to say is the weaker claim, and it is still the useful one: the mean is not describing a population of uniform coin flips, so it should not be read as one.
What Should You Actually Read Off a Tau-Bench Run?
The partition, not the average.
If reliability is concentrated, then the single score is the least informative number the run produces. What matters is which tasks landed in which group, and there are three of them.
Tasks that succeed on every trial are solved. Tasks that fail on every trial are almost never a reasoning problem, they are a missing tool, an ambiguous policy, or a goal state the agent has no path to reach. Tasks that sometimes pass and sometimes fail are the only group where model capability is genuinely the variable.
Those three need different work, and averaging them into one percentage guarantees you cannot tell them apart.
Tau-bench’s own history is the evidence for that middle claim. The SABER paper identifies “ceiling effects in τ-Bench, where annotation errors and underspecified tasks artificially cap model performance”, and released a corrected task set in response.
So the always-failing group really was substantially a benchmark problem rather than a capability problem, on the benchmark that made the metric famous. If it can happen there, assume it is happening in your own eval set.
This also reframes what improving a score means. You cannot gain on the tasks that already pass every time. Gains on the always-failing group usually come from fixing tools and clarifying policy text rather than from a better model. Only the unstable middle responds to the thing most teams reach for first.
The same logic applies to your own agent, whatever benchmark you use. Run the set repeatedly, keep the per-task outcomes, and look at the distribution before the mean.
Where Does Future AGI Fit?
At the part that requires keeping the detail rather than the summary.
Getting a partition instead of a score means running a fixed task set repeatedly and retaining per-task outcomes across runs, so a task that passed three times out of four is distinguishable from one that passed every time.
Policy adherence is the piece no general template covers, because the policy is yours. That is what custom eval templates are for: defining “any domain-specific, business, or regulatory rule” as criteria with placeholder variables, alongside 156 built-in templates across 14 groups.
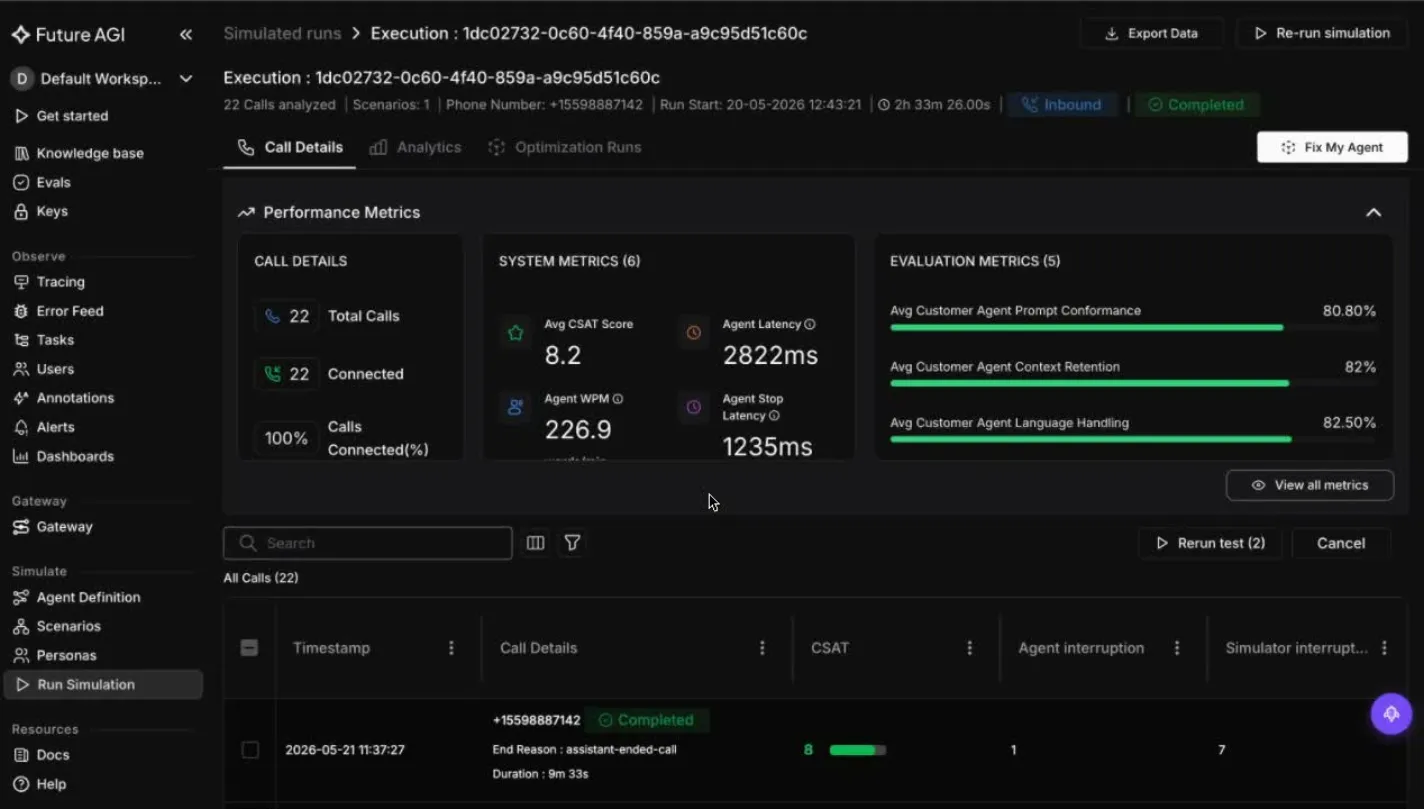
The useful view sorts tasks by how often they passed rather than by score, which separates the solved set from the unstable middle from the tasks that never work.
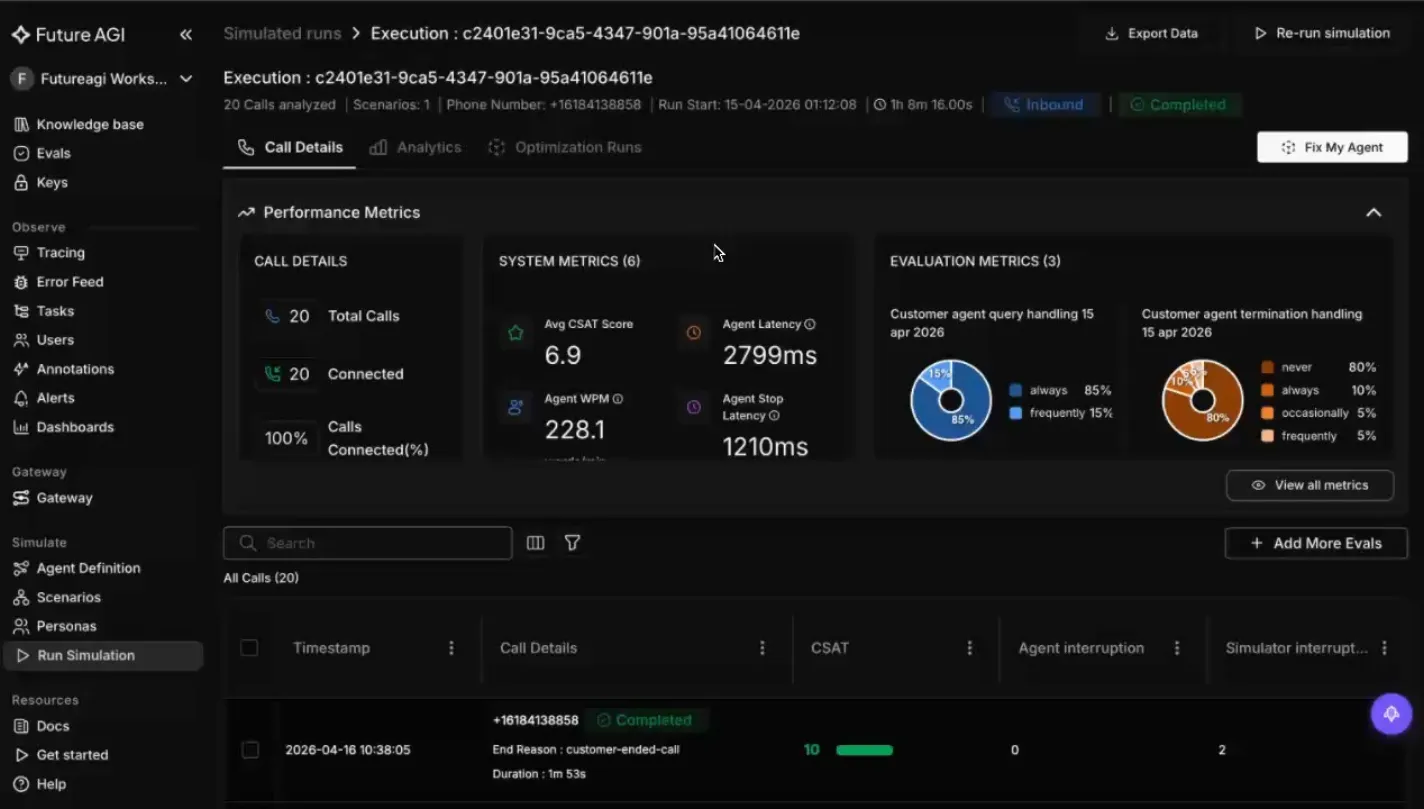
Scoring on end state rather than on transcript is the transferable idea here, and it applies to your own evals whether or not you ever run tau-bench. Assert on what the agent changed, not on how it described the change.
What Should You Take From Tau-Bench?
The method, more than the leaderboard.
Grade on state rather than on transcript, because an agent that narrates an action it never took is the failure mode that fluent models produce most often. The SABER analysis says why state is the right target: deviations in actions that change the environment are what flip a run to failure, while deviations elsewhere have “little to no effect”.
Run each task more than once, because a single trial cannot distinguish a reliable task from a lucky one. Keep the per-task results, because the mean is where the actionable structure goes to die.
And translate whatever rate you measure before you accept it. Take 69.2% as an illustration rather than a forecast, since it belongs to one 2024 model on a task set since revised.
At a thousand attempts a day, any 69.2% success rate is 308 failures a day and 112,420 a year. The grade reads as a pass. The failure count reads as a staffing plan. They are the same number.
Frequently Asked Questions About Tau-Bench
What Is Tau-Bench?
A benchmark for tool-agent-user interaction from Sierra, built around two customer service domains, airline and retail. The agent receives domain-specific API tools and written policy guidelines, then holds a conversation with a user played by a language model. Its authors built it because existing benchmarks “do not test language agents on their interaction with human users or ability to follow domain-specific rules”.
Is Tau-Bench Still the Current Benchmark?
No. The original repository now warns that its airline and retail tasks are outdated and points to tau-3-bench, which adds banking knowledge retrieval and voice evaluation and applies more than 75 task fixes. The 2024 version is still the right thing to study for its mechanism, since state grading and pass^k carried forward unchanged. It is the wrong thing to quote for current model scores.
What Is the Difference Between pass^k and pass@k?
pass@k is the probability that at least one of k attempts succeeds, which fits code generation where you can test candidates and keep the winner. pass^k is the probability that all k succeed. Tau-bench inverted it deliberately, because a support agent gets one attempt per customer and cannot check its own work, so how often it fails is the question that matters.
How Does Tau-Bench Decide Whether an Agent Succeeded?
By comparing the database state at the end of the conversation against an annotated goal state. The transcript is not graded. An agent that is fluent, polite and confident but never actually issued the refund scores zero, which is the detail that separates tau-bench from most conversational evaluations.
Who Plays the User in Tau-Bench?
A language model. The official implementation defaults to gpt-4o as the user simulator with an llm strategy, and ships react, verify and reflection strategies alongside it, with the user model swappable by flag. This matters when comparing scores, because the simulator is part of the measurement apparatus rather than a fixed environment.
What Is a Good Tau-Bench Score?
Scores were low across the board in the original paper, which is the point. It reports that the state-of-the-art function calling agents of the time, gpt-4o among them, succeeded on under half of tasks, with pass^8 below 25% in retail. More useful than the headline is the shape of the pass^k curve, since how quickly it decays tells you whether failure is spread evenly across tasks or concentrated in a subset that needs different work entirely.
Frequently Asked Questions
What is tau-bench?
Is tau-bench still the current benchmark?
What is the difference between pass^k and pass@k?
How does tau-bench decide whether an agent succeeded?
Who plays the user in tau-bench?
What is a good tau-bench score?
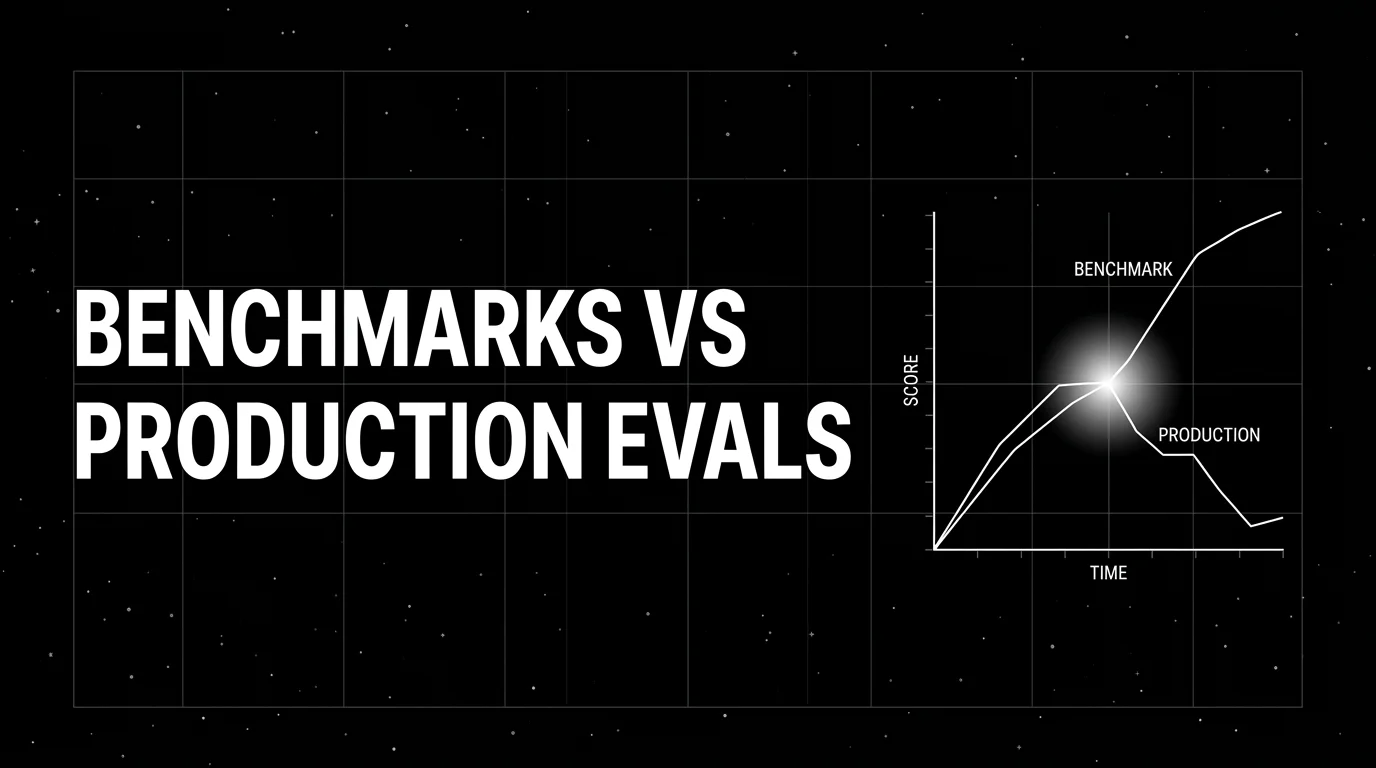
Public LLM benchmarks (MMLU, HumanEval, GSM8K) are contaminated and not predictive of production. Build domain reproductions that actually work in 2026.

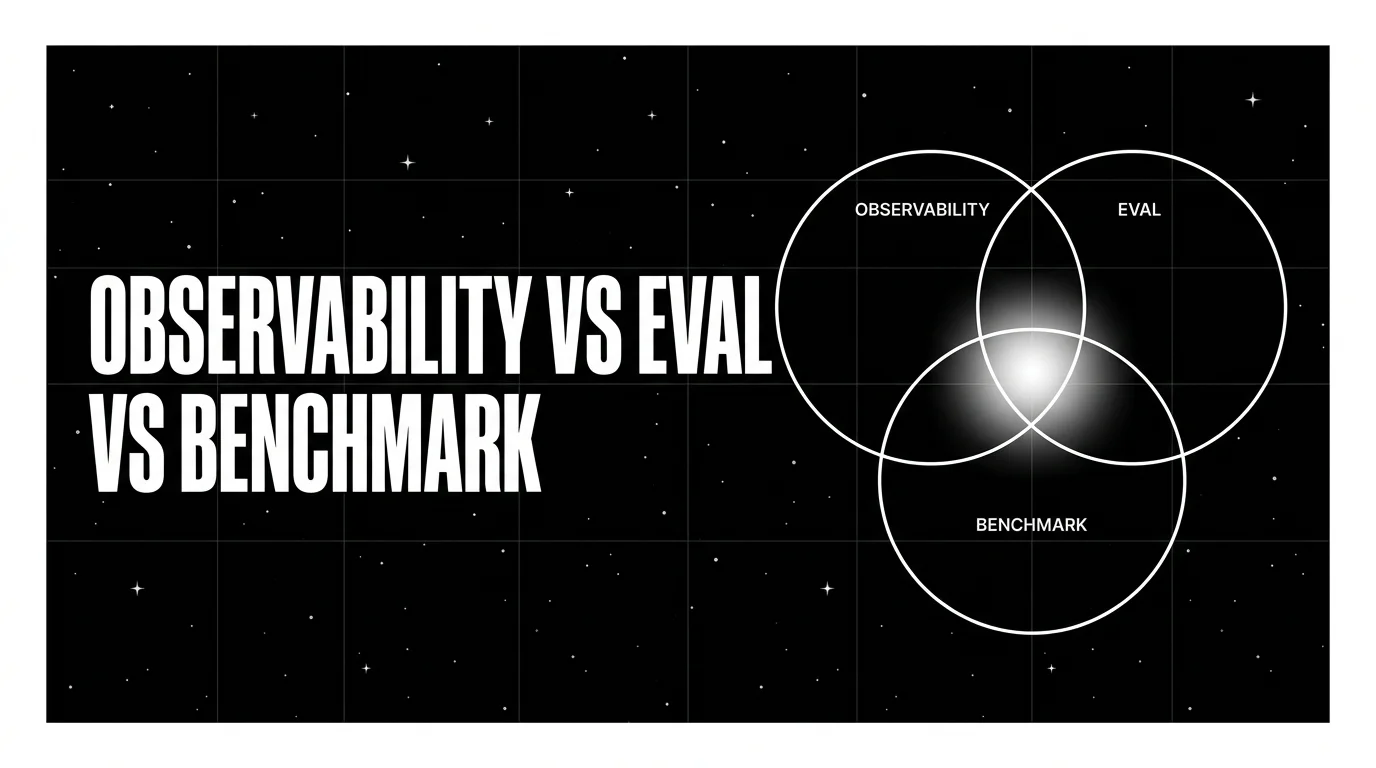
Observability watches. Evaluation judges. Benchmarking ranks. The conceptual map of the three terms agent teams conflate, with metrics, cadence, and tools.

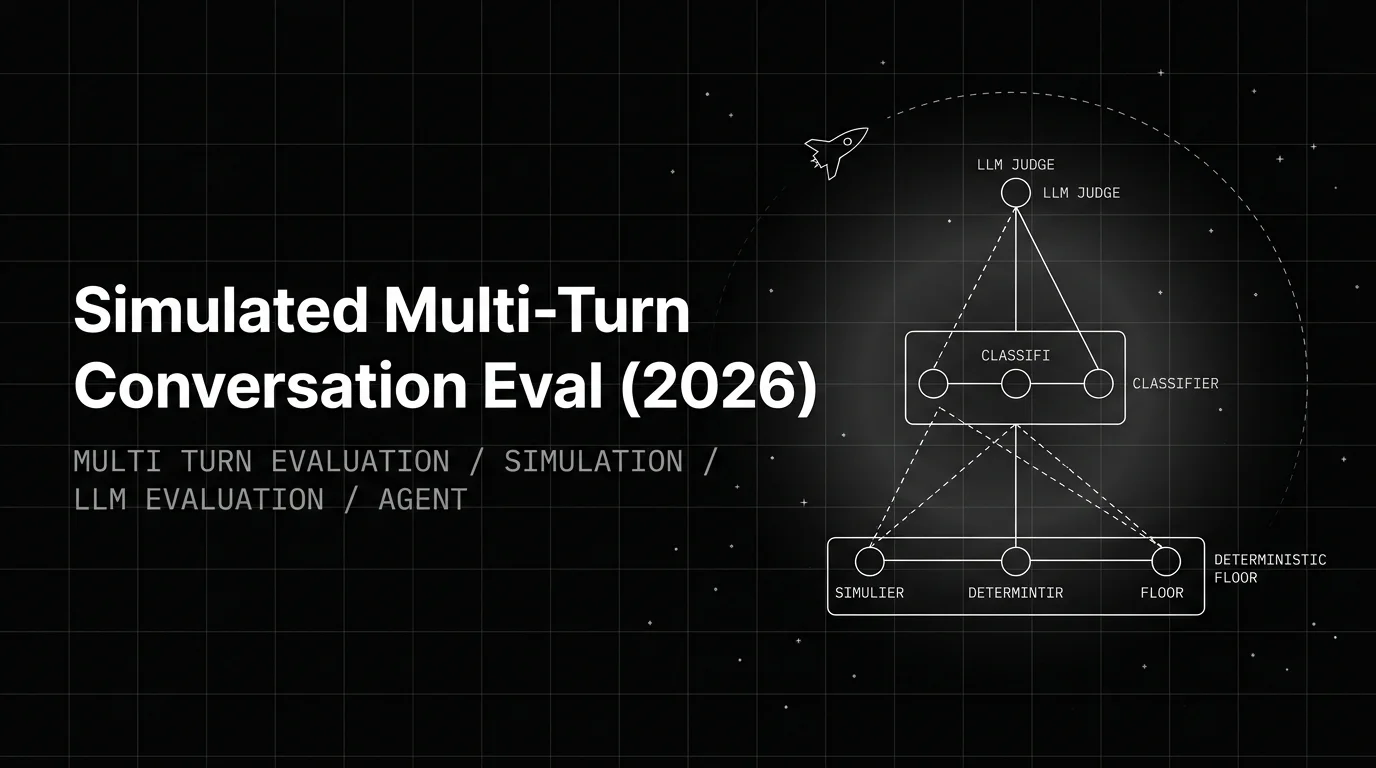
Build a simulated multi-turn eval that catches real failures: the Persona-Scenario-Adversary triangle, FAGI simulate-sdk patterns, trajectory scoring.