OpenAI API Rate Limits: Testing Provider Reliability Under Pressure
What RPM, TPM and the six spend tiers actually enforce, why 429s arrive under your cap, and how to check a provider holds up before launch day does it for you.
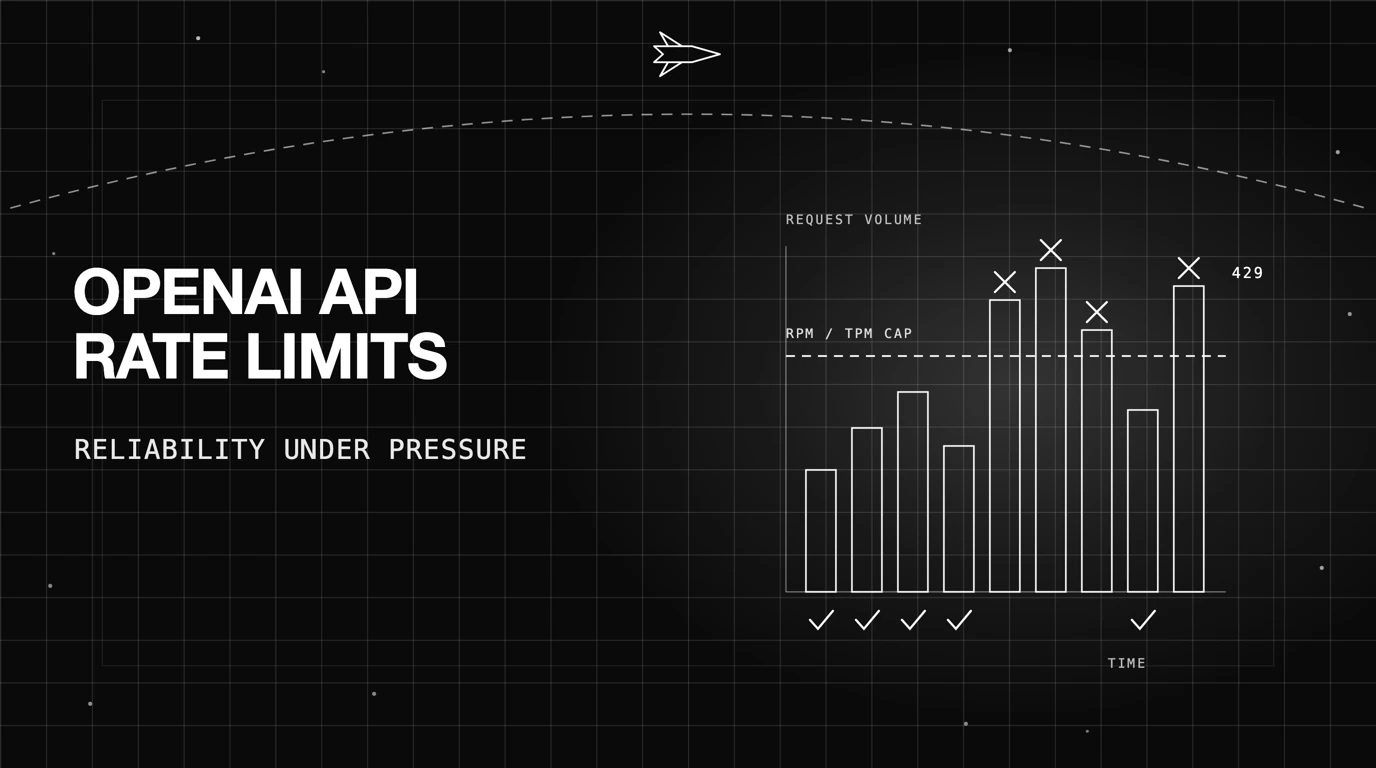
Table of Contents
A rate limit looks like a quota problem. Treat it as one and you learn how your provider behaves under pressure at the worst possible moment: in production, with real users watching.
429s show up in the logs at 3pm. Someone wraps the client in a retry loop, the errors stop, and the incident closes. The number gets treated as an obstacle to code around rather than information about the system you just bet your product on.
That framing costs you. A rate limit tells you where a provider stops absorbing your traffic, how it signals that boundary, and what it does at the edge. Those are reliability properties, and you can measure them deliberately instead of discovering them during a launch.
This post covers what OpenAI’s rate limits actually enforce, why teams get throttled while apparently under their cap, where backoff and multi-key setups stop helping, and how to test provider behavior under pressure before it turns into an incident.
What OpenAI’s API Rate Limits Actually Mean
A rate limit is a cap on how much traffic your account can push at the API. OpenAI sets these caps per model, and they are enforced “at the organization level and at the project level, not user level” (OpenAI rate limits guide). That scoping matters more than most teams expect.
The exact numbers are account-specific and live in your dashboard, not in the public docs. What the docs do define precisely is the shape of the system: which metrics exist, how they interact, and how you move between tiers.
RPM, TPM, RPD, and IPM: Any One of Them Can Return a 429
OpenAI measures usage with several metrics at once: requests per minute (RPM), requests per day (RPD), tokens per minute (TPM), tokens per day (TPD), images per minute (IPM), and audio minutes per minute for some streaming audio models. Each is enforced independently.
The docs are blunt about what that means. “Rate limits can be hit across any of the options depending on what occurs first. For example, you might send 20 requests with only 100 tokens to the ChatCompletions endpoint and that would fill your limit (if your RPM was 20), even if you didn’t send 150k tokens (if your TPM limit was 150k) within those 20 requests.”
So a workload of many tiny classification calls fails for a completely different reason than a workload of few enormous summarization calls. One dies on RPM with token budget to spare. The other dies on TPM after a handful of requests. Your traffic shape decides which wall you hit.
Some model families also share a single limit pool rather than each getting its own, per the docs: “Any models listed under a ‘shared limit’ in your organization’s limit page share a rate limit between them.” A team that starts routing traffic to a second model in the same family can hit a cap that looks unrelated to anything they just changed.
Batch traffic is counted differently again: “Batch API queue limits are calculated based on the total number of input tokens queued for a given model.” That is a separate pool from your synchronous TPM, which is the point: moving eligible work to Batch relieves pressure on the limits your live traffic depends on, but it is still metered on its own terms rather than exempt from accounting entirely.
The Six-Tier System Runs on Cumulative Spend
Access is organized into six usage tiers. Free sits at the bottom, qualified by geography, and Tier 1 through Tier 5 are qualified by how much you have paid OpenAI in total, starting at five dollars. Each tier carries a monthly usage limit alongside its per-model rate limits.
| Tier | Qualification | Monthly usage limit | What increases |
|---|---|---|---|
| Free | Allowed geography | $100 | Baseline access only |
| Tier 1 | $5 paid | $100 | Entry to paid rate limits |
| Tier 2 | $50 paid | $500 | Higher per-model RPM and TPM |
| Tier 3 | $100 paid | $1,000 | Higher per-model RPM and TPM |
| Tier 4 | $250 paid | $5,000 | Higher per-model RPM and TPM |
| Tier 5 | $1,000 paid | $200,000 | Highest published tier |
Source: OpenAI rate limits guide, figures verified 11 August 2026. OpenAI revises tier thresholds and monthly usage limits without notice and the page carries no version stamp, so treat this table as a dated snapshot rather than a contract. The per-model RPM and TPM numbers that actually bind you are account-specific: the docs publish only a high-level per-model summary on the models page, and the authoritative figures live on your organization’s limits page.
Note that the monthly usage limit and the rate limit are separate controls. The monthly figure caps total spend across the billing period. The rate limits cap throughput in any given minute or day. You can sit comfortably inside your monthly budget and still get throttled every afternoon.
Two things follow. Tier progression is automatic but retrospective, so a product that grows faster than its billing history hits ceilings a bigger account would not notice. And because limits scale with spend rather than with need, a new project inside an established organization typically inherits headroom a standalone account would have to earn, though per-project limits can be configured downward from what the org tier allows.
Why OpenAI API Rate Limits Are a Reliability Signal, Not Just a Quota
Every provider has a boundary. What distinguishes them is how legibly they tell you where it is, how they behave as you approach it, and whether the failure is clean. Those are the same questions you would ask about any dependency, and they deserve the same rigor.
Reading rate limits this way changes what you build. Instead of a retry wrapper bolted onto the client, you get a set of things worth measuring: error shape, recovery time, and whether output quality holds when the provider is busy.
Your Documented Limit Is Not What Gets Counted
Here is the detail that explains most surprise 429s. Per the docs, “your rate limit is calculated as the maximum of max_tokens and the estimated number of tokens based on the character count of your request.”
Set max_tokens to 4096 for safety and every call reserves 4096 tokens of TPM budget, even when the model returns forty tokens. Your dashboards show modest token consumption. OpenAI’s accounting sees something far larger. The gap between those two views is where teams get throttled while believing they have room.
Auditing max_tokens across a codebase is unglamorous and frequently recovers meaningful headroom. It is worth doing before you conclude you need a higher tier.
Limits Are Shared, So One Job Can Starve Another
Because limits are set at organization and project level, a batch reprocessing job and your live user-facing endpoint can be drawing on the same pool. The batch job does not fail. Your product does, because its requests happen to arrive second.
This is worth checking before anything else, because it is easy to confirm. Line up the timestamps of your 429s against the schedule of your internal jobs. If they overlap, you do not have a capacity problem yet.
Splitting workloads into separate projects with separate budgets is the structural fix, and it is cheaper than the alternative. Without it, every internal experiment is a potential production incident, and the incident will look like a provider problem when it is an allocation problem.
The Standard Fixes for OpenAI API Rate Limits, and Where They Stop Helping
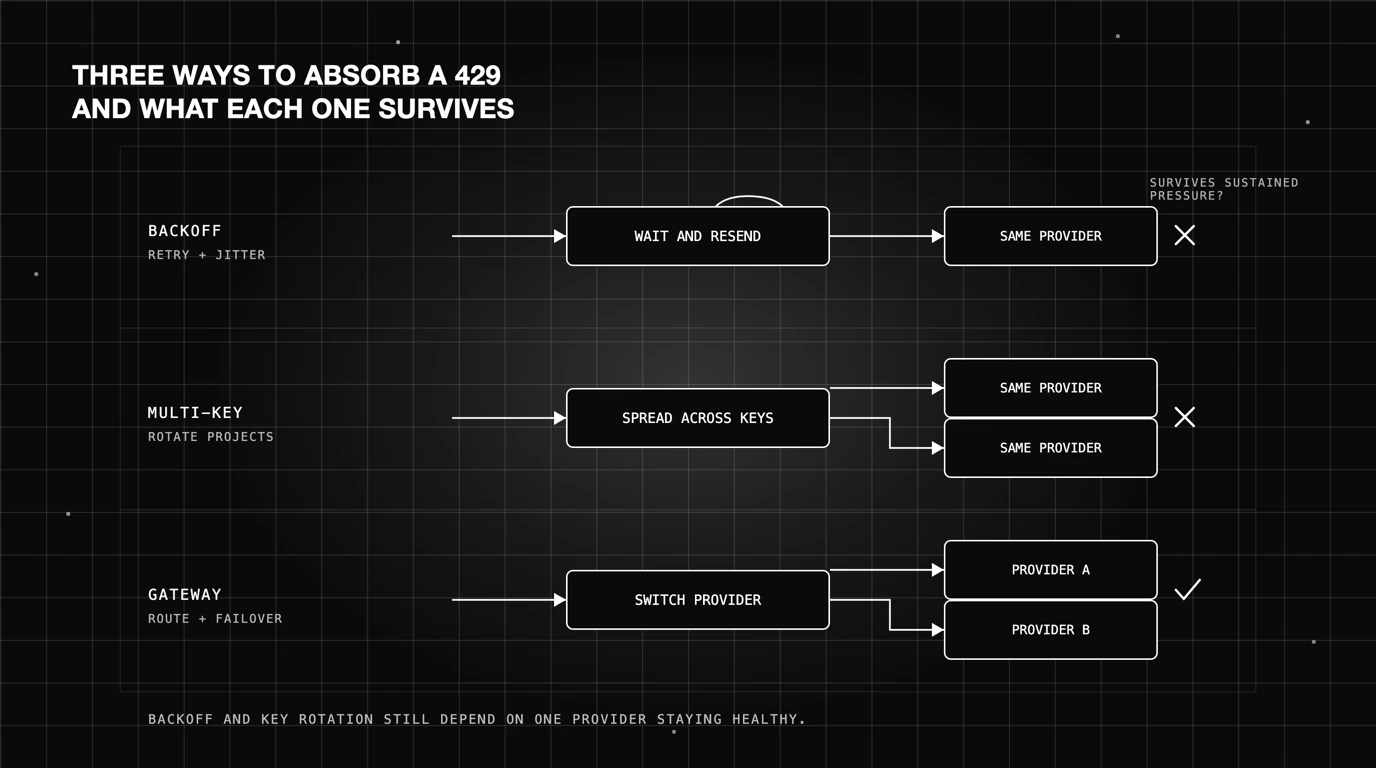
Two fixes dominate practice: retry with backoff, and spread traffic across more keys. Both are correct. Both solve a narrower problem than teams assume, and knowing which problem matters when you are choosing what to build next.
Exponential Backoff and the Retry-After Header
When you exceed a limit the API returns a 429, and the response “can include a Retry-After header that tells you how many seconds to wait before trying again.” It is not guaranteed on every response, so the docs recommend falling back to exponential backoff with jitter when it is missing or invalid. Official OpenAI SDKs already retry eligible errors and honor the header when present.
Response headers give you the rest of the picture: x-ratelimit-limit-requests, x-ratelimit-remaining-tokens, and x-ratelimit-reset-tokens, among others. Reading remaining-token headers lets you throttle before you get rejected rather than after.
Jitter is not optional here. Without it, a fleet of workers that all got throttled in the same second retries in the same second, and the second wave fails identically. Randomizing the wait spreads the recovery instead of synchronizing the next failure.
Backoff handles bursts. It does nothing for sustained pressure. If you are structurally over your cap for ten minutes, backoff converts a fast failure into a slow one, queues build, and latency climbs until something upstream times out.
Multi-Key Distribution and Its Coordination Cost
Rotating across several keys or projects raises effective throughput. The cost is that you now own a distributed accounting problem: which key has budget right now, how to avoid stampeding a key that just recovered, and how to keep spend attribution intact when traffic moves around.
It also does not survive a provider-wide degradation. Ten keys against one provider is still one provider. That is the limit worth naming, because it is the reason the next section exists.
| Strategy | Complexity | Resilience to sustained outages | Visibility into failures |
|---|---|---|---|
| Exponential backoff | Low, often built into the SDK | Low, delays failure rather than avoiding it | Per-call errors only, no aggregate view |
| Multi-key distribution | Medium, needs shared state and attribution | Low, all keys share one provider’s health | Fragmented across keys and projects |
| Gateway-level failover | Medium to set up, low to operate | High, routes to a healthy alternative provider | Centralized across every provider and route |
How Do You Test Provider Reliability Before It Becomes an Incident?
You test it the way you would test any dependency you cannot control: by running traffic that resembles your real traffic, and by watching more than the status code. Neither step is exotic. Both get skipped because rate limits get filed under billing rather than reliability.
Replay Your Real Traffic Shape, Not Just Peak Load
A flat load test at your expected requests-per-second tells you almost nothing, because the metric that breaks first depends on shape. Same total volume, different distribution, different failure. Model your actual pattern instead.
Three properties matter. Burstiness, because a spiky minute exhausts a per-minute cap that a smooth minute would clear. Token distribution, because a long tail of large prompts drains TPM disproportionately. And concurrency, because parallel workers hit the cap together rather than in sequence.
Run it against the account that will serve production, not a scratch project. Limits are scoped to the organization and project, so a test in a fresh sandbox measures a different set of caps than the ones your users will meet. The result would be reassuring and wrong.
Then check recovery, not just failure. How long after a 429 does the endpoint accept traffic again, does Retry-After match observed behavior, and does your client actually converge or thrash? Recovery time is the number that determines user impact.
Watch Quality, Not Only Latency
The failure that hurts most is not the 429. A 429 is loud, typed, and easy to alert on. The quiet failure is what your own fallback path does when the primary is throttled.
You degrade to a smaller model, or you truncate context to fit remaining budget, or a retry lands on a different deployment. The request now succeeds. Your latency dashboard looks fine. The answer is worse, and nothing in your infrastructure metrics will say so.
Scoring outputs during a pressure test is what closes that gap. Compare responses produced under load against the same prompts on an unloaded path, and you find out whether your degradation strategy is graceful or just invisible. Our guide on LLM fallback strategies covers how to structure those paths so the tradeoff is deliberate.
Moving OpenAI API Rate Limit Handling to a Gateway Layer
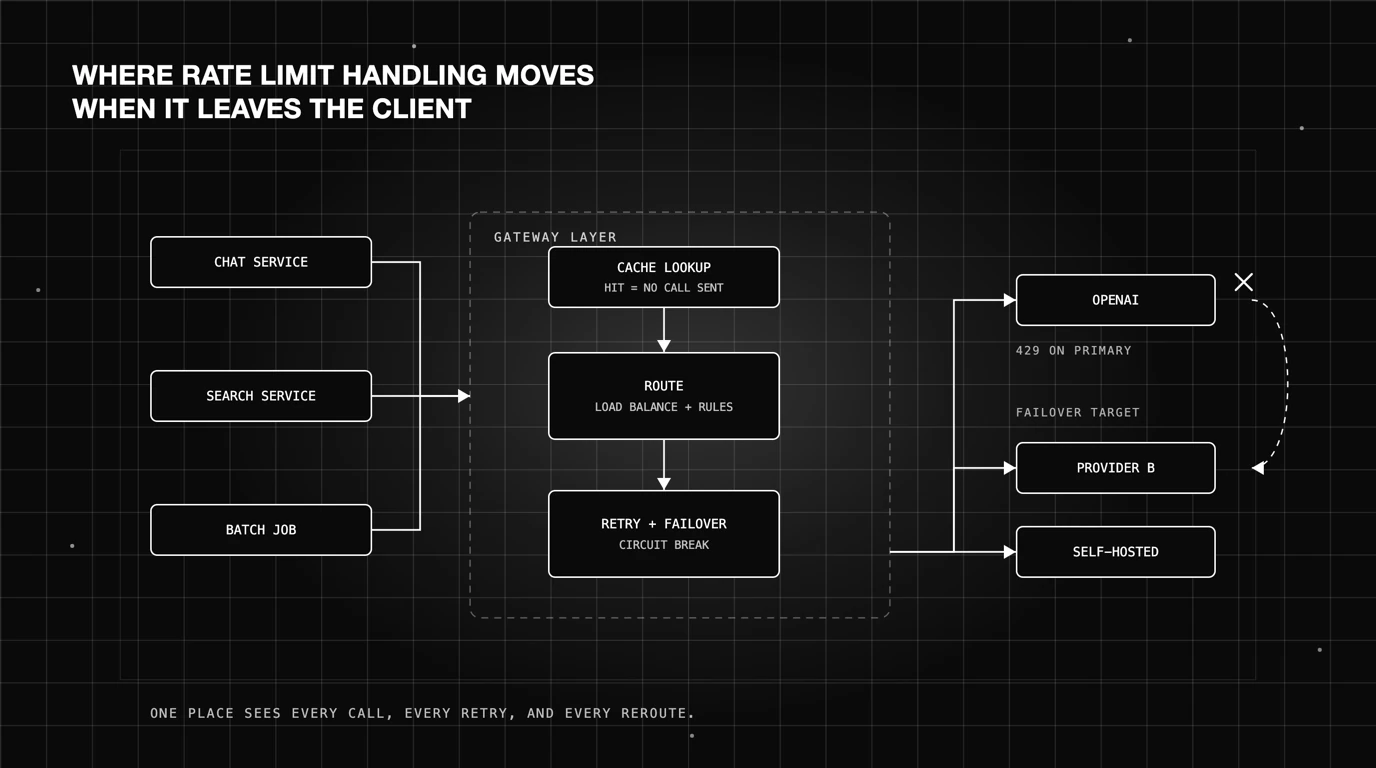
Once several services call the same provider, per-client retry logic stops scaling. Each service carries its own backoff, its own key handling, and its own partial view of what failed. A gateway consolidates all of it into one place that sees every call.
Routing and Failover Across Providers
The core move is treating a single provider as replaceable rather than fixed. A gateway sits between your app and every model API, load balances across them, and reroutes when one degrades. Retries, failover order, and circuit breaking become configuration rather than code shipped in five services.
Failover is only useful if you have decided in advance what the alternative is allowed to do. A cheaper backup model that answers every request is not automatically better than a clean error, and that call belongs to the product, not the routing table. Write the policy down before you configure it.
That is also the only answer to the ceiling described earlier. When one provider is throttling you organization-wide, more keys will not help and a second provider will. What an AI gateway is walks through the pattern in more detail.
Semantic Caching Cuts Volume Before It Hits a Limit
The cheapest request against a rate limit is the one you never send. Exact-match caching catches identical calls, which is common in templated and deterministic workloads. Semantic caching goes further by matching similar phrasings through vector embeddings.
For support assistants and internal search, where users ask the same question a dozen ways, this removes real volume from your TPM accounting. It also removes the corresponding cost, which is usually what gets the work prioritized. Our breakdown of gateway-level rate limiting covers where these controls sit in a stack.
How Future AGI Handles Rate Limits, Routing, and the Failures They Cause
Future AGI is not a load-testing tool. It will not generate synthetic throughput against a provider to find your ceiling, so use a load generator for that. What it covers is everything on either side of the ceiling: setting your own limits, routing around theirs, and seeing what broke when you hit one.
The gateway enforces rate limits of its own, which is the part most relevant here. You can set per-key, per-organization and global RPM limits, and enforce monthly spend budgets and per-key credit balances to protect provider quotas (Rate Limiting docs). The most restrictive limit applies, so a global cap and a tighter per-key cap resolve to the per-key one. That is the structural fix for the allocation problem above: cap the batch job at the gateway so it cannot drink the throughput your checkout flow needs.
Beyond that, it covers the two things that matter after you know where that ceiling is: routing around it, and seeing what happened when you hit it.
Agent Command Center is a gateway across 100+ cloud and self-hosted LLM providers, with load balancing, failover, and conditional routing, plus configurable retries and circuit breaking. Non-OpenAI providers are “automatically translated to the standard OpenAI format,” so switching does not mean rewriting call sites (docs.futureagi.com/docs/command-center).
Access runs through virtual keys with per-key controls, and the same layer handles spend monitoring, budget limits, and guardrail policies. Caching is opt-in and supports both exact-match and semantic strategies, with configurable TTL and namespaces, though streaming requests bypass the cache entirely (docs.futureagi.com/docs/command-center/features/caching).
Observe turns every request into a trace: the record of model calls, tool calls, and retrievals behind one response, captured with status, latency, and token usage. Sessions group related requests, which is how you reconstruct what a user experienced across a throttled window rather than one call at a time (docs.futureagi.com/docs/observe).
Error Feed runs on top of those traces without configuration, grouping related failures into named clusters and tracking whether an issue is increasing, decreasing, or stable (docs.futureagi.com/docs/error-feed). That trend line is the difference between one bad afternoon and a pattern worth acting on.
Evaluation is what addresses the quiet failure. Custom evals score responses against a definition of quality you control, and they can run on production traces as well as offline datasets (docs.futureagi.com/docs/evaluation). Scoring output from a throttled period against output from a normal one tells you whether your fallback held.
Conclusion
OpenAI’s rate limits are well documented in structure and deliberately vague in specifics: six spend-based tiers, several independent metrics, and per-account numbers you read off your own dashboard. Knowing that shape is the starting point, not the finish.
The practical work is elsewhere. Audit max_tokens before assuming you need a higher tier. Separate batch workloads from user-facing ones so they stop competing. Test with your real traffic shape rather than a flat load curve, and measure recovery rather than just failure.
Then look past the 429 itself. The expensive failure is the one where your fallback quietly returns a worse answer and every infrastructure metric stays green. A rate limit is a window into how a provider behaves under pressure. Open it before production does it for you.
Frequently Asked Questions
What is the OpenAI API rate limit?
How do I fix a 429 Too Many Requests error from OpenAI?
What are OpenAI's usage tiers and how do I move up?
How does tokens per minute differ from requests per minute?
Why am I rate limited when I am under my documented limit?
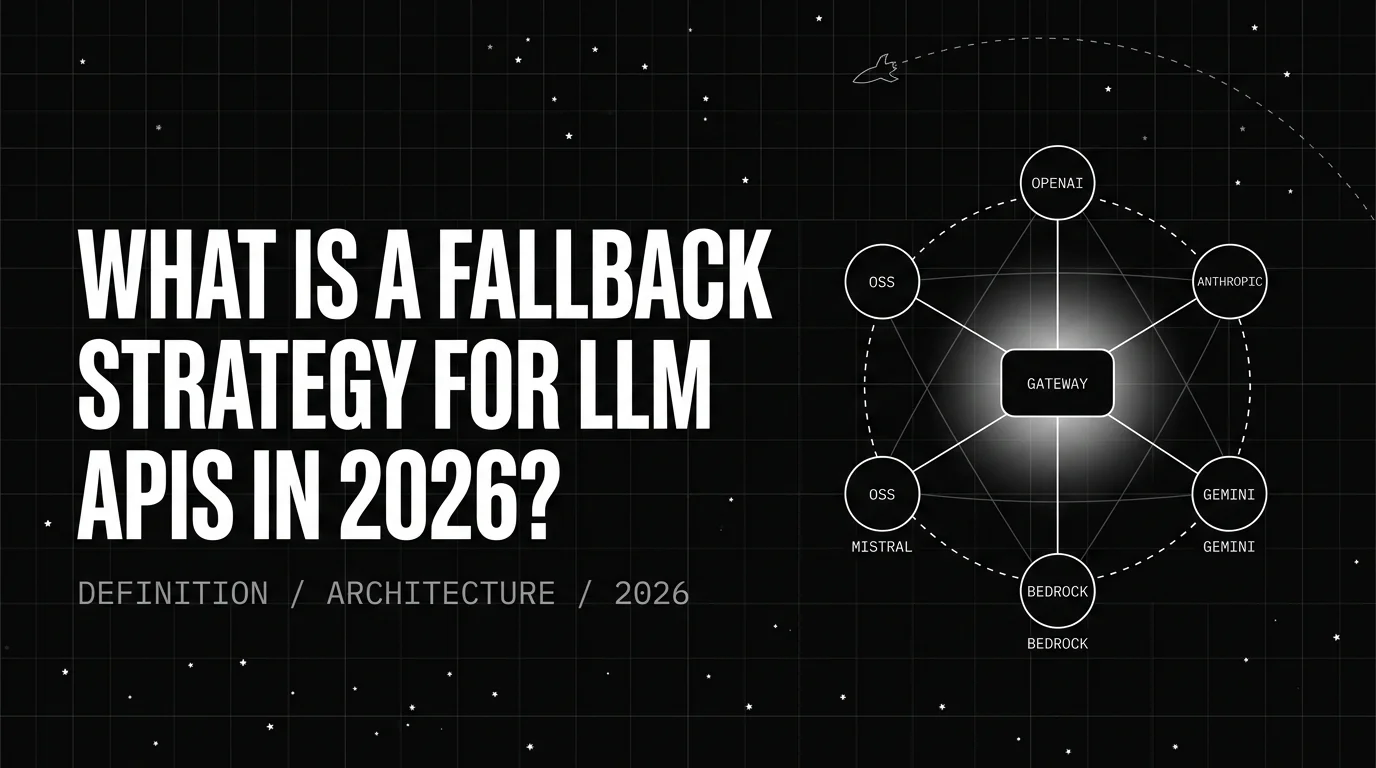
A 2026 field guide to LLM fallback strategy: definition, five strategies, architecture, buyer's guide, myths, and OTel GenAI auditable spans.

Five AI gateways for rate limiting LLM calls in 2026 scored on the seven-axis rubric, provider-tier awareness, fair-share, rate-limit observability.


An AI gateway sits between apps and LLM providers for governance, routing, observability. What it is, how it differs from API gateways.