What Is Temperature in LLM Output: What to Measure Before You Tune
How temperature reshapes token probabilities, why temperature 0 still drifts, and the variance and faithfulness checks to run before locking a value.
Table of Contents
Someone changes a temperature value from 0.7 to 0.3, the outputs look tidier in three manual spot checks, and the number ships. Two weeks later a support ticket arrives about an answer nobody can reproduce.
That is a common way temperature gets set: by feel, on a handful of eyeballed samples, with no record of what the old setting actually did. The parameter is one of the few knobs that changes model behavior on every single request, and it is also one of the easiest to leave unmeasured, since a wrong value rarely throws an error.
This post covers what temperature does to the math, why temperature 0 is not the same as determinism, how it differs from top-p and top-k, and the measurements worth running before you change the default. It ends with a workflow for locking a value in and a table you can copy.
What Temperature Actually Controls in LLM Output
Temperature is a sampling parameter, not a personality setting. At each step the model produces a score for every token in its vocabulary, and temperature decides how sharply those scores translate into selection probabilities. Nothing about the model’s knowledge changes when you move it.
That distinction matters because it tells you what temperature can and cannot fix. It cannot make a model know something it does not know. It can only change how tightly the model commits to its own top-ranked guesses.
How Temperature Reshapes Token Probability
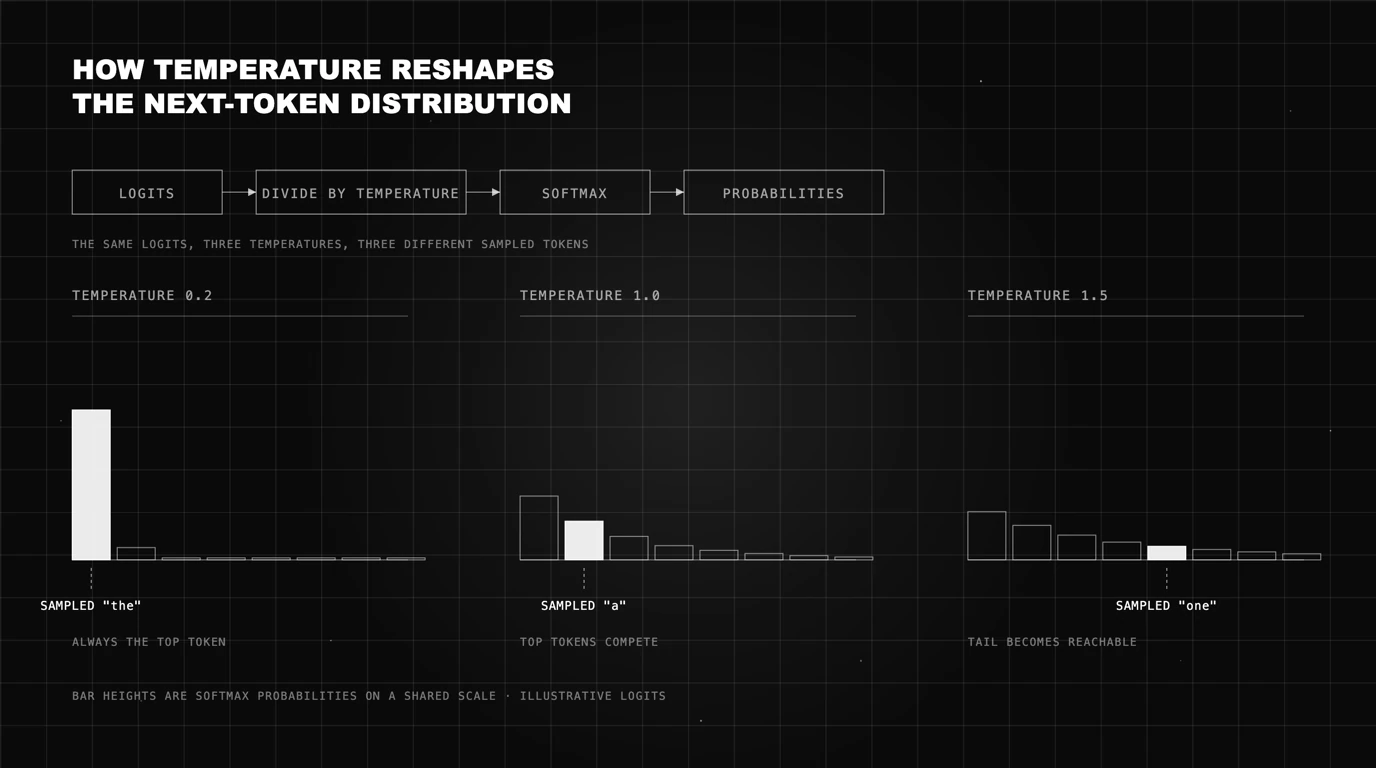
The model outputs raw scores called logits. Before sampling, each logit is divided by the temperature value, and the results go through a softmax that turns them into probabilities summing to one. Dividing by a number below 1 spreads the logits further apart; dividing by a number above 1 pulls them together.
Spread-apart logits produce a spiky distribution. The top token takes most of the probability mass and the rest get very little, so the same prompt keeps producing the same continuation. That is the low-temperature regime.
Pulled-together logits produce a flat distribution. Tokens that ranked fourth or tenth now hold enough probability to be picked, so repeated runs diverge. That is the high-temperature regime, and it is why high temperature feels more varied.
Why “Temperature Equals Creativity” Is an Oversimplification
The creativity framing survives because the surface behavior matches it. Raise temperature, get more surprising word choices, call it creative. The mechanism underneath is narrower than that.
Flattening the distribution promotes lower-ranked tokens. Some of those are genuinely better phrasings the model under-weighted. Others are errors, wrong names, and invented details that the low-temperature setting would have suppressed. The parameter cannot tell those two groups apart.
So a higher value buys variance, and variance is a raw material rather than a quality. On a brainstorming task variance is useful. On an invoice extraction task the identical mechanism is what starts inventing field values.
Does Temperature 0 Mean Fully Deterministic Output?
No, and the gap between the two ideas causes real debugging pain. Temperature 0 removes randomness from the sampling step: the model takes its highest-probability token every time. What it does not do is remove every other source of run-to-run variation in a production serving stack.
Anthropic’s own API reference is explicit about this, noting that “even with temperature of 0.0, the results will not be fully deterministic” (Messages API reference). Treat temperature 0 as a strong reduction in variance, not a guarantee of identical bytes.
Note that 0 is a special case, not just a small divisor: dividing a logit by zero is undefined, so implementations do not actually divide at temperature 0. They fall back to greedy decoding, taking the highest-probability token directly. That substitution is why the drift described below comes entirely from outside the sampling step.
Where Drift Comes From at Temperature 0
Thinking Machines Lab investigated this directly and landed on a specific cause. Floating-point arithmetic is non-associative, so the order of operations changes results in the last bits, but their finding was that the deeper problem is kernels that are not batch-invariant. Serving load varies, batch size varies with it, and reduction order inside operations like RMSNorm and attention shifts accordingly.
Their measurements make the size of the effect concrete. On Qwen3-235B-A22B-Instruct-2507, sampling 1,000 completions at temperature 0 with an identical prompt produced 80 unique completions, with the first divergence appearing at token 103 despite identical prefixes through token 102 (Defeating Nondeterminism in LLM Inference, Thinking Machines Lab, 2025).
After swapping in batch-invariant kernels, all 1,000 completions were identical. The exact counts are specific to that model and serving setup; the mechanism they demonstrate is general.
The practical reading: your own request did not change, but the requests sharing the batch with it did. That is invisible from the client side, which is why “it worked yesterday” bug reports at temperature 0 are so frustrating to chase.
Temperature Versus a Fixed Random Seed
These two controls get conflated constantly. Temperature shapes the probability distribution the sampler draws from. A seed fixes the random number stream that the sampler consumes when it draws.
A fixed seed with a mid-range temperature can reproduce a run, because the same random draws hit the same distribution. Temperature 0 with no seed control removes the draw entirely but leaves everything downstream of the distribution untouched, including the batching behavior above.
If reproducibility is the actual requirement, say so and test for it. Log the temperature, the seed if your provider exposes one, the model version, and the exact prompt, then re-run the same input and compare. Reproducibility is a property you verify, not one you configure.
LLM Temperature vs. Top-P vs. Top-K
Temperature, top-p, and top-k all act on the same distribution, in different ways. Temperature rescales it. Top-k truncates it to a fixed count of the highest-probability tokens. Top-p, or nucleus sampling, truncates it to the smallest set of tokens whose probabilities add up past a threshold.
The order of operations matters: temperature reshapes first, then the truncation rules cut from whatever shape it produced. That is exactly why tuning them together goes wrong.
| Control | What it does to the distribution | Effect of raising it | Typical use |
|---|---|---|---|
| Temperature | Scales all logits before softmax | Flatter distribution, wider token choice | Primary variance control |
| Top-p | Keeps the smallest token set summing past a probability threshold | Admits more low-probability tokens | Trimming an unreliable tail |
| Top-k | Keeps a fixed number of top-ranked tokens | Admits more candidates regardless of probability | Hard cap on candidate count |
Why Adjusting Temperature and Top-P Together Confuses Results
Suppose you raise temperature to 1.2 and drop top-p to 0.8 in one change. Output variety barely moves. You now cannot tell whether the temperature increase did nothing, or whether it did plenty and the tighter top-p cut absorbed it before sampling.
The two changes are entangled. Temperature moves probability mass toward the tail, and top-p decides how much of that tail survives, so one can cancel the other. Provider guidance that tells you to alter one and leave the other alone is making this same point about confounded variables, not stating an arbitrary rule.
Pick temperature as the variable you sweep, hold the truncation parameters at their defaults, and only touch top-p once temperature is settled. Two variables at once turns a measurement into a guess.
Provider Defaults Are Not the Same
Anthropic’s Messages API documents a temperature default of 1.0 on a 0.0 to 1.0 range, and describes top-p and top-k as advanced controls rather than everyday ones (Messages API reference). Not every provider uses that same 0.0 to 1.0 scale.
Do not assume a 0.7 you read about in a general guide sits at the same point on your provider’s scale. Confirm the range in that provider’s own reference before you copy a number.
That has a direct consequence when you swap models: the same numeric value can sit at a different position on each provider’s scale, which is one reason a migration can change output character even when the prompt is unchanged. Table 1 below assumes a 0.0 to roughly 2.0 scale, the common range across most providers; on Anthropic’s 0.0 to 1.0 scale, treat each bound as roughly half.
Check the reference page for whichever API you call, and record the default alongside your chosen value. If you cannot name your provider’s default, you do not yet know whether you are tuning up or down from it.
What to Measure Before You Tune Temperature
Tuning temperature without measurement is how teams end up with a magic number nobody can defend. Three measurements make the decision evidence-based, and none of them need special infrastructure.
Sample the Same Prompt Across Repeated Runs
Take ten representative prompts from your actual traffic. Run each one 20 times at your current setting and store every output. This is the baseline, and if you have never produced it, you do not yet know your current variance, only your impression of it.
Then measure how much those 20 outputs differ from each other. Pairwise text similarity gives you a number; for structured outputs, count how many runs produce the same parsed fields. Either way you now have a variance figure instead of an impression.
If you assumed an extraction pipeline was stable and this baseline turns up field-level disagreement across runs, that is worth checking against your bug tracker: separate reports of the same field coming back wrong on different days can be one shared cause rather than several unrelated bugs.
Track Faithfulness and Hallucination Metrics Across Settings
Variance alone does not tell you whether output got worse. A run can be perfectly consistent and consistently wrong. Pair the consistency measurement with quality scoring on the same outputs.
For grounded tasks such as retrieval-augmented answering, faithfulness is the metric that matters: is every claim in the output supported by the retrieved context? Score it at each temperature setting on the same prompts and you can see whether raising the value costs you grounding, on your data, rather than in the abstract.
Be careful with the received wisdom here. Higher temperature plausibly increases ungrounded claims because it promotes lower-probability tokens, but the size of that effect depends on your model, your prompt, and your context. Measure it rather than importing a number from a blog post. Our guide to LLM evaluation metrics covers how these scores are computed.
Set a Task-Specific Baseline First
The default value is a hypothesis, not a starting truth. Before changing anything, record what the current setting produces: variance across repeats, quality scores, and a small set of outputs a human has actually read.
Without that record, any change becomes unfalsifiable. Outputs after the change will look different, and different always reads as better to whoever made the change. A baseline is what turns that into a comparison.
Store the baseline where the next person will find it, next to the prompt in version control rather than in a spreadsheet on someone’s laptop. Temperature outlives the engineer who set it.
Choosing an LLM Temperature by Use Case
Use-case ranges are a starting point for your sweep, not a substitute for it. The ranges below reflect the task’s tolerance for variance, which is the only thing temperature actually controls.
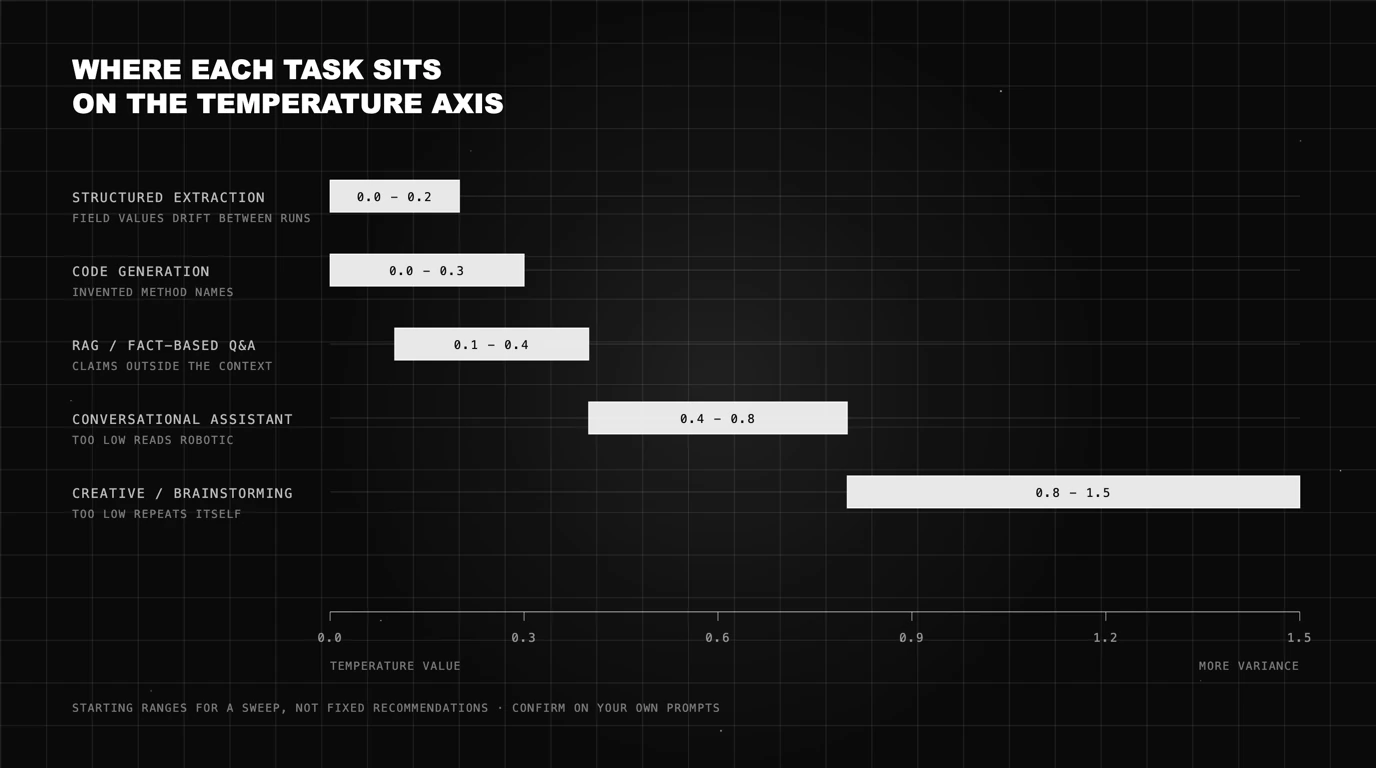
Table 1 — Temperature by use case
| Task type | Starting range | Rationale | Risk if mismatched |
|---|---|---|---|
| Structured extraction / classification | 0 to 0.2 | One correct parse exists; variance is pure downside | Field values drift between runs and schema validation fails intermittently |
| Code generation | 0 to 0.3 | Syntax and API names must be exact and repeatable | Invented method names, inconsistent style, non-reproducible builds |
| RAG / fact-based Q&A | 0.1 to 0.4 | Answer is constrained by retrieved context | Claims that read fluently but are not supported by the context |
| Conversational assistant | 0.4 to 0.8 | Some phrasing variety avoids stilted repetition | Too low reads robotic; too high drifts off-instruction mid-conversation |
| Creative / brainstorming | 0.8 to 1.5 | The output set is meant to be diverse | Too low returns the same three ideas every time |
Ranges above assume a roughly 0.0 to 2.0 provider scale. If your API caps temperature at 1.0, as Anthropic’s does, halve each bound as a starting point and confirm against your own sweep.
Structured and Extraction Tasks Want the Low End
When a task has one correct output, variance can only hurt. An extraction job pulling five fields from a document has a single right answer per field, so any sampling randomness is an opportunity to get one of them wrong.
Low temperature also makes downstream code simpler. Schema validators, parsers, and retry logic all behave better when the output shape is stable, and intermittent parse failures are among the most annoying bugs to reproduce.
Pair the low setting with structural checks rather than trusting it. Validating that the output is well-formed JSON with the expected keys catches the failures temperature alone will not prevent. The same discipline shows up in any eval harness worth running.
Conversational and Creative Tasks Tolerate More
A support assistant answering the same question 50 times a day at temperature 0 sounds like a recording. Some variation in phrasing is the point, and the cost of a differently worded but equally correct answer is close to zero.
Creative tasks go further, because a diverse output set is the deliverable. Generating 20 campaign lines at temperature 0.2 gives you three ideas and 17 near-duplicates.
The catch is that instruction-following degrades as the distribution flattens. Push high enough and the model starts drifting from format requirements and constraints, which is why the high end needs output validation more than the low end does, not less.
A Simple Evaluation Workflow for Locking In a Temperature Value
The workflow below takes an afternoon and produces a number you can defend in review. It assumes you have a set of representative prompts and some way to score outputs, which is the same setup any regression suite needs.
Run a Small Sweep and Compare Consistency
Pick five values spanning your candidate range, for example 0, 0.3, 0.5, 0.7, and 1.0. Hold everything else constant: prompt, model version, top-p, top-k, max tokens. Run every prompt 20 times at each setting.
For each setting compute two things. First, consistency: how similar the 20 outputs are to one another. Second, quality: your task metric, whether that is faithfulness, exact match against a golden answer, or a rubric score.
Twenty runs across five settings on ten prompts is 1,000 calls. On a short-prompt task with a mid-sized model that is minutes of wall time and a small fraction of most inference budgets. Price it yourself first if your prompts are long or you are testing a frontier model, since cost scales with context length and per-token rate, not with the sweep design.
If the total feels heavy, cut the prompt count before you cut the repeats. Repeats are where the variance signal lives, and five runs per setting is too few to distinguish a stable configuration from a lucky one.
Plotting both against temperature usually shows a knee. Consistency falls off past a certain point while quality stays flat, and that knee is the useful information the sweep produces. It is specific to your task, which is exactly why the generic ranges in Table 1 are only a starting point.
The sweep does not need custom scoring code. Both halves reduce to two evaluate() calls per output, run pairwise against the 20 outputs collected at each setting:
from fi.evals import evaluate

# Consistency: pairwise similarity across the 20 outputs at one setting
consistency_scores = [
    evaluate("levenshtein_similarity", output=outputs[i], expected_output=outputs[j])
    for i in range(len(outputs)) for j in range(i + 1, len(outputs))
]

# Quality: faithfulness against retrieved context, for grounded tasks
quality_scores = [
    evaluate("faithfulness", output=o, context=retrieved_context)
    for o in outputs
]
Run that loop once per temperature setting, average each list, and plot both series against temperature. That plot is the knee described above. For a task without retrieved context, swap faithfulness for whatever metric defines correct on your task, an exact match against a golden answer or a rubric score.
Table 2 — Temperature versus output behavior (directional, illustrative)
| Temperature band | Output variance | Consistency and faithfulness trend | Best paired with |
|---|---|---|---|
| Near 0 | Lowest | Highest consistency; still not byte-identical across runs | Extraction, classification, deterministic pipelines |
| Low-mid | Moderate | Task-dependent; usually stable on constrained prompts | Grounded Q&A over retrieved context |
| Mid-high | Higher | Wider spread; grounding needs active checking | Conversational and exploratory tasks |
| High | Highest | Least predictable; strongest case for output validation | Brainstorming, with guardrails and human review |
This table is directional. It describes the direction each band moves in, not measured percentages, because the actual magnitudes depend on your model and prompt. Anyone quoting a fixed hallucination percentage for a temperature band should be asked which model, which task, and which dataset produced it.
Lock the Value Once Variance Is Acceptable
Pick the highest temperature whose consistency still clears your threshold. Higher values give the model more room, so there is no reason to sit lower than you need to, and no reason to sit higher than your task tolerates.
Then write the value down with its evidence: the sweep results, the date, the model version, and the threshold you chose. That record is what stops the next engineer from re-litigating the number from scratch.
Re-run the sweep when the model version changes. A new checkpoint has a different probability landscape, so a temperature tuned against the old one is an assumption again rather than a measurement. Treating settings this way is the same habit behind deterministic evaluation metrics.
Future AGI
The sweep described above is a dataset experiment. Experiments run different prompt and model combinations against the same dataset, score the outputs with built-in evals, and put the results side by side — which is the workflow in this section with temperature as the variable you change between runs. Prompt versions keep each configuration you tested addressable afterwards, so the setting you shipped stays traceable to the run that justified it.
If you would rather search the space than enumerate it, the optimization layer ships random search for a quick baseline and Bayesian search, which learns from earlier trials to pick better configurations instead of sampling blindly.
The scoring side is a single call. The SDK’s evaluate() function is the main entry point for running evaluations, and it routes automatically: no model argument runs the local engine, a Turing model routes to the cloud engine, and any other model string routes to LLM-as-judge. You call the same function whether the metric is heuristic or judge-based.
For the grounding half of the measurement, the hallucination metrics cover five context-grounded checks: faithfulness, claim_support, factual_consistency, contradiction_detection, and hallucination_score. Each returns a continuous score between 0.0 and 1.0, invoked as evaluate("faithfulness", output=..., context=...). Run the same metric over outputs from each temperature setting and you get the quality curve.
For the consistency half, the local metrics catalogue includes string and similarity measures such as levenshtein_similarity, described as edit-distance similarity between texts, alongside bleu_score and rouge_score. These run locally through the same evaluate() function with no API key. Comparing repeated outputs from one prompt pairwise gives you the variance number the sweep needs.
Anything the built-ins do not cover is custom eval territory. LLM-as-judge lets you write grading criteria in plain English and run them through the same evaluate() call. A schema-conformance check specific to your extraction format is a good example: define the check yourself and score it next to the built-ins in the same run.
Conclusion
Temperature is a variance control. It scales logits before the softmax, and everything else people attribute to it, creativity included, is downstream of that one mechanical fact.
Temperature 0 buys you a lot of that variance back but not all of it. Anthropic documents that outputs are not fully deterministic at 0.0, and Thinking Machines Lab traced the residual drift to kernels that are not batch-invariant, measuring 80 unique completions out of 1,000 runs before the fix.
Which leaves measurement as the only honest way to pick a value. Sweep a few settings on your own prompts, score consistency and grounding at each, take the knee, and write down what you found. The default your provider ships is a hypothesis, and it costs one afternoon to test it.
Frequently Asked Questions
What is temperature in LLM output?
Does temperature 0 mean the output is fully deterministic?
What is the difference between temperature and top-p?
Does higher temperature cause more hallucinations?
What temperature should I use for coding versus creative writing?
There aren't 50 LLM eval metrics. Three primitive families and eight rubrics matter in production. 2026 reference with CI gate and per-trace eval cascade.

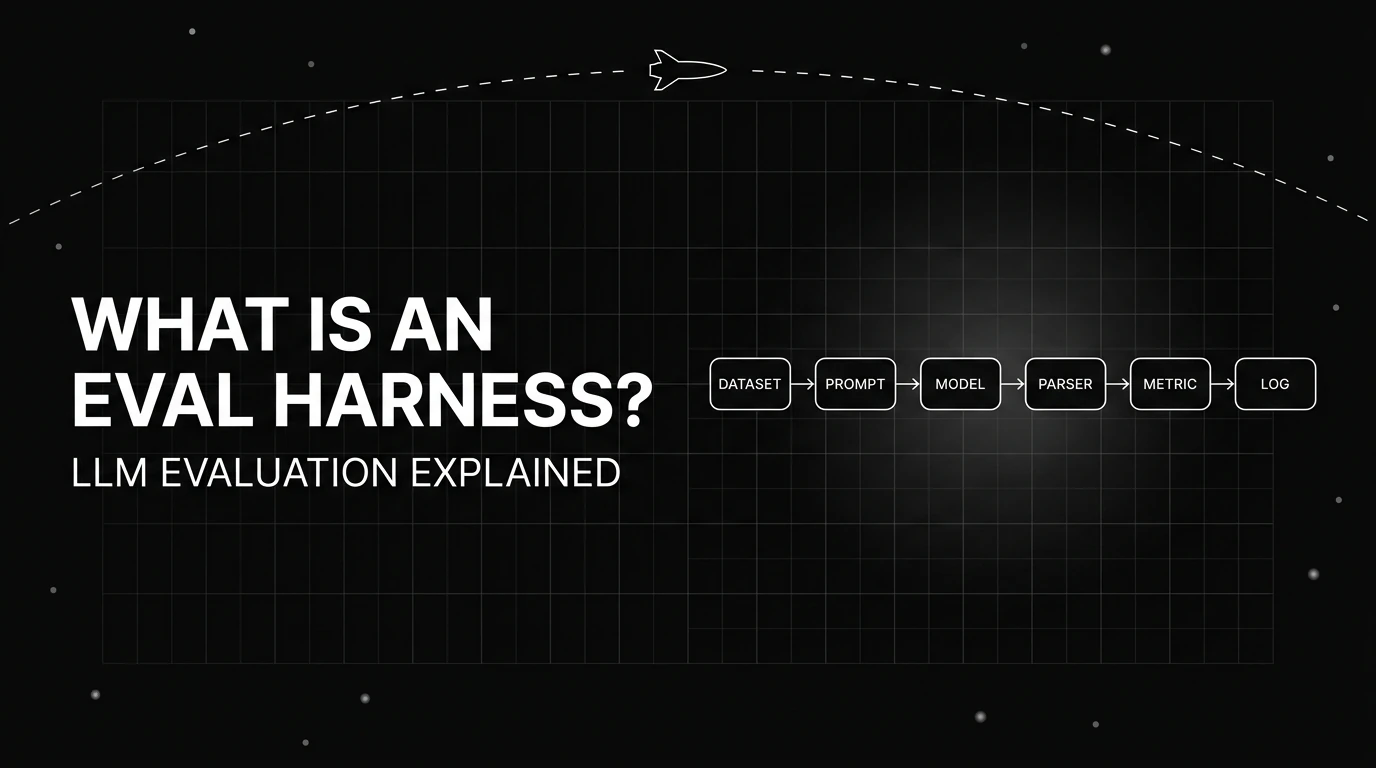
An eval harness is the software that turns an LLM benchmark into a reproducible score. See how it loads tasks, formats prompts, scores outputs, and logs.


Schema, regex, exact match, BLEU/ROUGE, citation-validity. Where deterministic LLM eval metrics catch 30-60 percent of failures before a judge fires.